The Economics and Statistics Division maintains archives of previous publications for accountability purposes, but makes no updates to keep these documents current with the latest data revisions from Statistics Canada. As a result, information in older documents may not be accurate. Please exercise caution when referring to older documents. For the latest information and historical data, please contact the individual listed to the right.
<--- Return to Archive
For additional information relating to this article, please contact:
January 31, 2020US PERSONAL INCOME AND OUTLAY, DECEMBER AND ANNUAL 2019 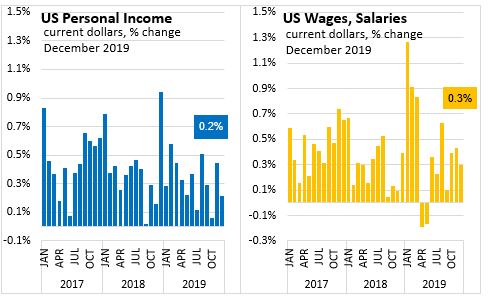
The US Bureau of Economic Analysis reports that US personal income increased $40.7 billion, or 0.2 per cent in December 2019 (seasonally adjusted levels at annualized rates).
“The increase in personal income in December primarily reflected increases in compensation of employees and personal interest income that were partially offset by a decrease in farm proprietors’ income. Farm proprietors’ income decreased $36.2 billion in December, which included a decrease in subsidy payments associated with the Department of Agriculture’s Market Facilitation Program."
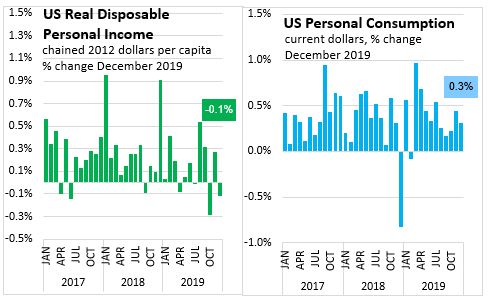
US personal disposable income increased $30.6 billion, or 0.2 per cent in December 2019 to $16.7 trillion.
In real per capita terms, US disposable personal income decreased $54.0 to $45,877 (Chained 2012 dollars) or 0.1 per cent in December 2019.
Personal Outlays increased $51.5 billion in December 2019. he largest part of the increase was in US personal consumption expenditures which increased $46.6 billion, or 0.3 per cent in December 2019.
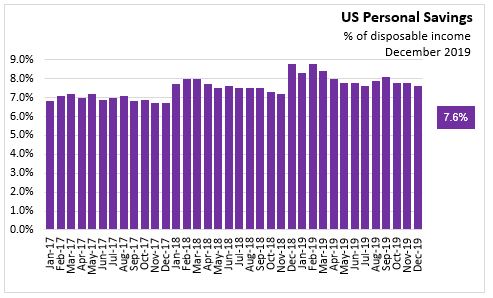
Personal savings (disposable personal income minus personal consumer expenditures, interest paid, and transfers to government and the rest of the world) decreased $20.8 billion in December 2019 to $1.276 trillion.
The personal savings rate was 7.6 per cent of disposable income, down from 7.8% in November 2019.
ANNUAL
The US Bureau of Economic Analysis reports that US personal disposable income increased $696.6 billion, or 4.5 per cent in 2019 to $16.4 trillion.

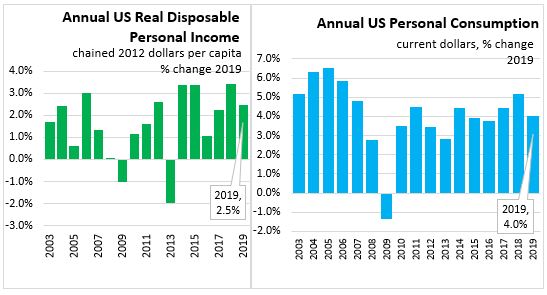
In real per capita terms, US disposable personal income increased $1,102. to $45,623 (Chained 2012 dollars) or 2.5 per cent in 2019.
Personal Outlays increased $595.5 billion in 2019. The largest part of the increase was in US personal consumption expenditures increased $565.2 billion, or 4.0 per cent in 2019
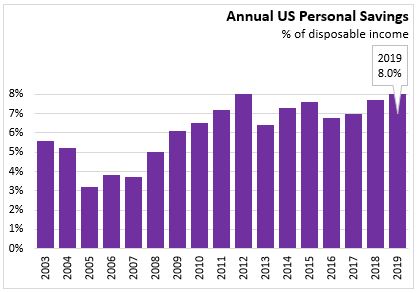
Personal savings (disposable personal income minus personal consumer expenditures, interest paid, and transfers to government and the rest of the world) increased $101.1 billion in 2019 to $1.312 trillion.
The personal savings rate was 8.0 per cent of disposable income, up from 7.7% in 2018.
Source:
US Bureau of Economic Analysis
Press Release
Monthly Table 2.6. Personal Income and Its Disposition, Monthly NIPA
Annual Table 2.1. Personal Income and Its Disposition
<--- Return to Archive