The Economics and Statistics Division maintains archives of previous publications for accountability purposes, but makes no updates to keep these documents current with the latest data revisions from Statistics Canada. As a result, information in older documents may not be accurate. Please exercise caution when referring to older documents. For the latest information and historical data, please contact the individual listed to the right.
<--- Return to Archive
For additional information relating to this article, please contact:
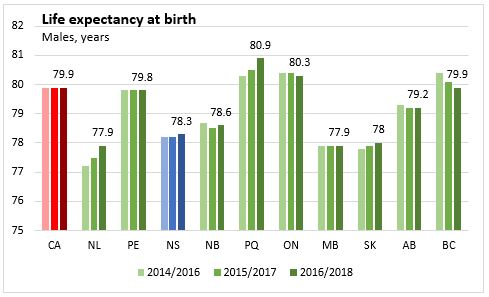
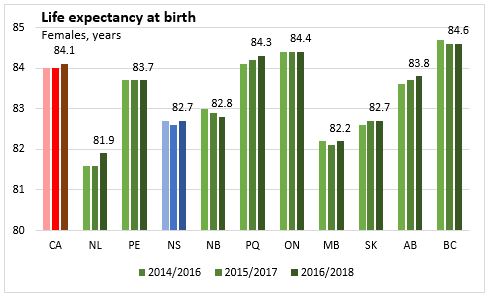
January 28, 2020LIFE EXPENTANCY, 2016-2018 From 2015/2017 to 2016/2018, life expectancy at birth for both males and females in Nova Scotia increased 1.2 months to 78.3 years for males and 82.7 years for females. During the same period, life expectancy at birth remained unchanged at 79.9 years for Canadian males increased 1.2 months to 84.1 years for Canadian females. Female life expectancy has generally been higher than that of males, though that gap has been closing as growth in male life expectancy has outpaced that of females over the available data period. In 2016/2018, the gap between Nova Scotian female and male life expectancy at birth was 4.4 years, compared to 7.6 years in 1980/1982.

Historically, Nova Scotia's life expectancy at birth has been lower than that of Canada, varying by year and sex. The gap has widened in recent years as gains for Nova Scotia males and females have stalled while gains at the national level for both males and females have continued at a steady pace.
According to data for about 40 OECD countries, Canada's life expectancy at birth ranks 16th among females and 13th among males in 2017.
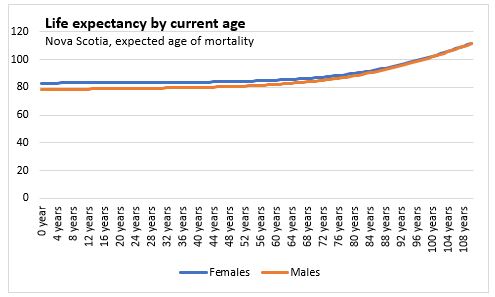
The following two charts show Nova Scotian life expectancy by current age, expressed in two different ways. The first shows, at each given age, the number of years remaining that a person can expect to live while the second chart shows, at each given age, the age a person can expect to live to.
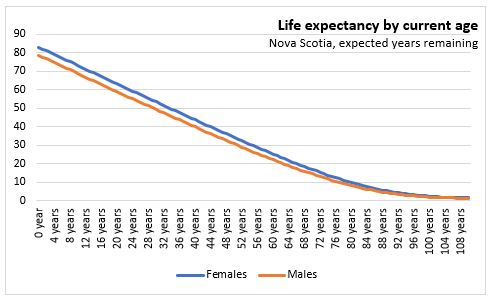
As can be seen, life expectancy remains fairly steady from birth until around age 60, after which it increases disproportionately. As well, beyond around age 60, the gap between male and female life expectancy begins to close.
The source of gains in life expectancy has also changed over time. During the 20th century, much of the gains in life expectancy came from decreases in the infant (under 1 year) and juvenile (between 1 and 4 years) mortality rate. However, in the 21st century, there have been more significant gains in life expectancy at age 60 and above compared to the two decades prior, and smaller gains below that.

Looking across the country, Nova Scotia had the seventh highest life expectancy among both males and females at birth. Male life expectancy at birth in 2016/2018 was the highest in Quebec at 80.9 years, followed by Ontario and British Columbia- two provinces above the Canadian average, British Columbia has same life expectancy as the national average. All other provinces were below the national average. Ontario, Saskatchewan and British Columbia have had a decline in male life expectancy since 2015/2017.
British Columbia had the highest life expectancy at birth among females, followed by Ontario and Quebec. All other provinces were below the national average. New Brunswick has had a decline in female life expectancy since 2015/2017.
Source: Table: 1310011401
Table: 1310014001
<--- Return to Archive