The Economics and Statistics Division maintains archives of previous publications for accountability purposes, but makes no updates to keep these documents current with the latest data revisions from Statistics Canada. As a result, information in older documents may not be accurate. Please exercise caution when referring to older documents. For the latest information and historical data, please contact the individual listed to the right.
<--- Return to Archive
For additional information relating to this article, please contact:
January 08, 2020NOVA SCOTIA TRADE OPENNESS 2018 TRADE OPENNESS
The Nova Scotia provincial economic accounts provide the best measures of trade. The robustness of the data allows for the derivation of many indicators that provide significant insight to the trade sector.
The trade openness index calculates the ratio of trade to GDP then takes an index of the ratio. It is an indicator of trade expansion or contraction relative to GDP. If the index is above 100, it indicates that a trade component is rising faster than GDP, suggesting increasing importance of that trade component in the Nova Scotia economy. Included components are export (E), import (I), goods (G) and services (S), international (intN) and interprovincial (IntP) trade.
Total trade is a measure of all external trade activity. The total trade openness index is an indicator of trade expansion or contraction relative to growth in GDP. Included components are export (E), import (I), goods (G) and services (S), international (intN) and interprovincial (IntP) trade.
The following overview provides a long-range view to highlight trade over the last 25 years. This period (1993-2018) saw dramatic global trade. China's production and trade expanded rapidly. Nova Scotia exported a new, major commodity (natural gas) but from 2001-2018, production largely declined from year to year. Commodity (notably oil) prices increased from 2002 - 2014, then fell. There was a global financial crisis, an economic recession and economic recovery.
INTERNATIONAL TRADE OPENNESS 1993-2018
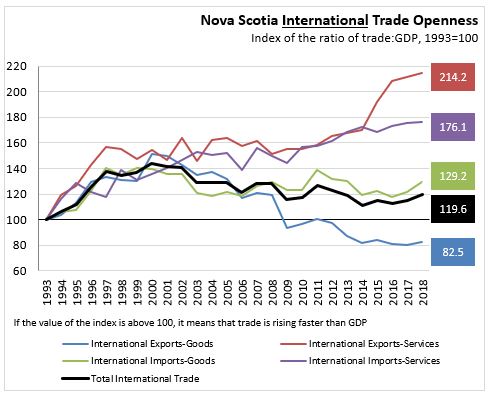
In the period 1993 to 2000, Nova Scotia's Total Openness Measures indicate that trade was expanding (increasing faster than GDP).
While GDP (Index 1993=100) increased 133.9% (CAGR 3.5%),
- International Exports of Goods increased 93.0% (CAGR 2.7%). This was slower than growth in GDP, so international goods exports have played a smaller role in the Nova Scotia economy.
- International Exports of Services increased 401.1% (CAGR 6.7%). This was faster than growth in GDP, so international service exports have played an increasingly larger role in the Nova Scotia economy.
- International Imports of Goods increased 202.2% (CAGR 4.5%). This was faster than growth in GDP, so international goods imports have played a larger role in the Nova Scotia economy.
- International Imports of Services increased 311.9% (CAGR 5.8%). This was faster than growth in GDP, so international service imports have played a larger role in the Nova Scotia economy.
- TOTAL International trade increased 179.8% (CAGR 4.2%). This was faster than growth in GDP, so overall international trade has played a larger role in the Nova Scotia economy.
INTERPROVINCIAL TRADE OPENNESS 1993-2018
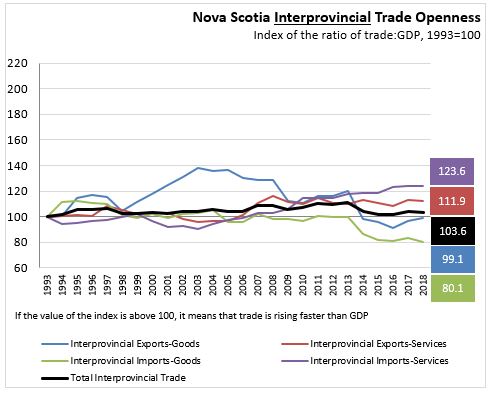
In the period 1993 to 2000, Nova Scotia's Total Openness Measures indicate that trade was expanding (increasing faster than GDP).
While GDP (Index 1993=100) increased 133.9% (CAGR 3.5%),
- Interprovincial Exports of Goods increased 131.9% (CAGR 3.4%). This was similar to the growth in GDP, so interprovincial goods exports have maintained about the same role in the Nova Scotia economy.
- Interprovincial Exports of Services increased 161.8% (CAGR 3.9%). This was larger than the growth in GDP, so interprovincial services exports increased their role in the Nova Scotia economy.
- Interprovincial Imports of Goods increased 87.4% (CAGR 2.5%). This was less than the growth in GDP, so interprovincial goods imports declined in significance for the Nova Scotia economy.
- Interprovincial Imports of Services increased 189.1% (CAGR 4.3%). This was larger than the growth in GDP, so interprovincial services imports increased their role in the Nova Scotia economy.
- TOTAL Interprovincial trade increased 142.3% (CAGR 3.6%). This was larger than the growth in GDP, so overall interprovincial trade increased its role in the Nova Scotia economy, entirely because of rising service trade.
TOTAL TRADE OPENNESS 1993-2018

In the period 1993 to 2000, Nova Scotia's Total Openness Measures indicate that trade was expanding. (increasing faster than GDP).
While GDP (Index 1993=100) increased 133.9% (CAGR 3.5%),
- TOTAL Exports of Goods trade increased 107.5% (CAGR 3.0%). This was slower than the growth in GDP, so goods exports reduced their role in the Nova Scotia economy.
- TOTAL Exports of Services increased 210.8% (CAGR 4.6%). This was larger than the growth in GDP, so services exports increased their role in the Nova Scotia economy.
- TOTAL Imports of Goods increased 154.8% (CAGR 3.8%). This was larger than the growth in GDP, so goods imports increased their role in the Nova Scotia economy.
- TOTAL Imports of Services increased 204.8% (CAGR 4.6%). This was larger than the growth in GDP, so services imports increased their role in the Nova Scotia economy.
- TOTAL TRADE increased 159.4% (CAGR 3.9% ). This was larger than the growth in GDP, so international and interprovincial trade accounts for a growing part of Nova Scotia's economy.
Statistics Canada Tables 36-10-0222-01
<--- Return to Archive