The Economics and Statistics Division maintains archives of previous publications for accountability purposes, but makes no updates to keep these documents current with the latest data revisions from Statistics Canada. As a result, information in older documents may not be accurate. Please exercise caution when referring to older documents. For the latest information and historical data, please contact the individual listed to the right.
<--- Return to Archive
For additional information relating to this article, please contact:
January 02, 2020NOVA SCOTIA NET TRADE 2018 The trade data in the national economic accounts represent total, international, interprovincial trade in goods and services. From this data one can derive net trade, which is the difference between exports and imports.
At the higher levels of trade data aggregation, Nova Scotia usually reports more imports of goods and services than exports. With rare exception, the Nova Scotia trade balance is usually a deficit. At lower commodity and/or industry classification, there is a greater mix of trade activity with greater possibility of positive trade balances in some area, but these disaggregates are outside the scope of this analysis.
Over the last twenty-five years, Nova Scotia trade deficits have increased in most measures. In some cases, the trade balance is expanding (e.g. international goods 2010-2018) and in others it is deteriorating (e.g. interprovincial goods 2010-2018). The overall balance, however, is negative and total nominal deficits are increasing. The trend of increasing deficits began the recession of 2007-2009 but have accelerated since then.
The trade data in the economic accounts represent provincial total and net expenditures in interprovincial (intP) and international (intN) markets. As there are important differences in the characteristics of intN and intP markets, it is useful to provide a separate analysis. In this note, the focus is on international (intN) trade.
Several components of Net trade are considered separately and in combination. These include exports, imports, goods, and services trade. Total Net trade is the sum of intN imports and exports, goods and services. It is the measure of total net trade activity in all markets.
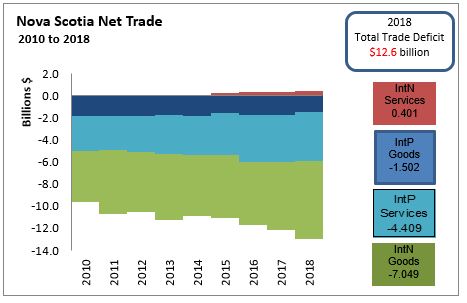
Total net trade is comprised of four components. In 2018, in order by value, they are:
- Net intN Goods trade deficit with other countries increased $606 million to $7.0 billion;
- Net intP Services trade deficit with other province declined $72 million to $4.4 billion;
- Net intP Goods trade deficit with other provinces declined $240 million to $1.5 billion); and
- Net intN Services trade surplus with other countries increased $40 million to $401 million);
- Summed, the net trade deficit increased $734 million to $12.6 billion.
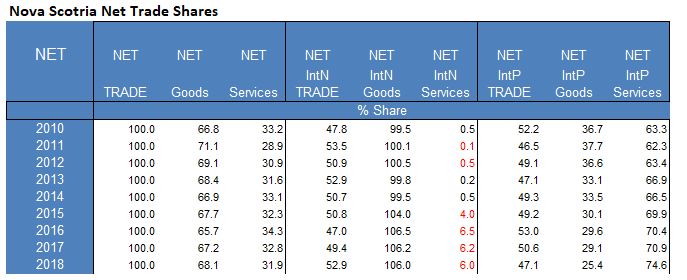
By commodity category:
- The Net Goods trade deficit in all external markets totalled $8.551 billion (68.1% share) dominate
- The Net Services trade deficit in all external markets totalled $4.008 billion (31.9% share).
By market category:
- The Net Trade deficit other countries totalled $6.648 billion (52.9% share) dominate
The Net trade deficit with other provinces totalled $5.911 billion (47.1% share).
NOVA SCOTIA NET TRADE SHARE 2010 2018
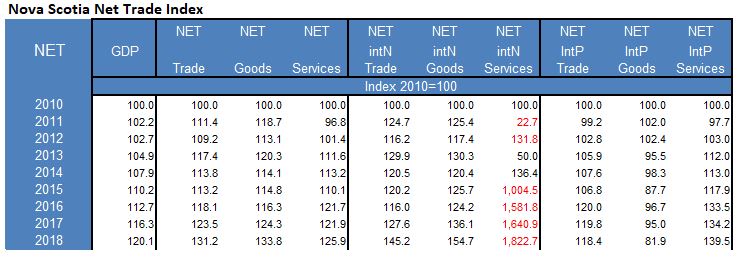
NOVA SCOTIA NET TRADE INDEX 2010 2018
NOVA SCOTIA NET TADE 1993-2018
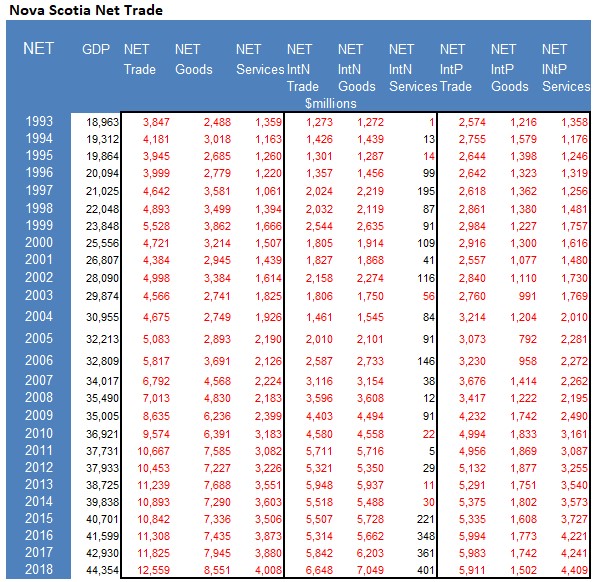
LONG RUN NET TRADE
The trade data in the national economic accounts represent total, international, interprovincial trade in goods and services. From these data one can derive net trade, which is the difference between exports and imports.
Net Export Trade as a % of GDP
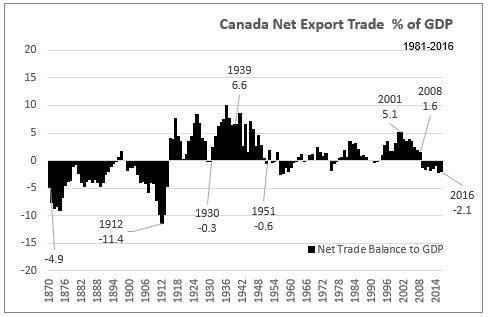
Canada
In the period 1870 to the start of World War 1, Canada was a small agrarian nation. The Canadian Net Trade to GDP profile is characterized by long periods of negative trade balances.
In the period 1914 to 1950, Canada reported positive international trade balances in all years, with the exception of 1930.
After 1950, international trade has been characterized by intermittent periods of annual trade deficits and trade surpluses. In 2009, with the collapse of the global trade market, Canada entered a period of annual trade deficits.
Nova Scotia
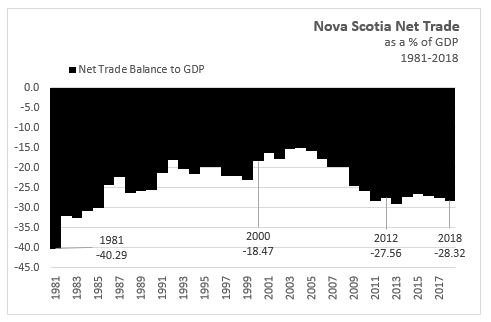
The province does not have as long a time series on GDP and net exports, as does Canada. Available data for the provinces only reaches back to 1961. The “net exports” for the provinces also includes interprovincial net exports, where by definition, the interprovincial net exports would be zero for Canada. As interprovincial trade is roughly half that of international trade, the ratios (net exports to GDP) would be at least twice the magnitude of a Canada calculation.
The aggregation of provincial international trade would have a similar effect to generating a smaller ratio (net exports), as provinces with international trade surpluses would reduce the impact of provinces with international trade deficits.
While the net-exports to GDP ratio for Canada ranged from -12 to +12, the Nova Scotia net-exports to GDP ratio ranged from -50 to -15. The negative and magnitude nature of the indicator should express the inter-dependence of trading partners and the openness of their combined markets.
SOURCES:
STC Daily October 11, 2017.
Analytical Studies Branch Research Paper Series (Catalogue number11F0019M),
Statistics Canada Study: A Long-run Version of the Bank of Canada Commodity Price Index
CANSIM 383-0027.. 383-0028 , 384-0038 and 384-0015
<--- Return to Archive