The Economics and Statistics Division maintains archives of previous publications for accountability purposes, but makes no updates to keep these documents current with the latest data revisions from Statistics Canada. As a result, information in older documents may not be accurate. Please exercise caution when referring to older documents. For the latest information and historical data, please contact the individual listed to the right.
<--- Return to Archive
For additional information relating to this article, please contact:
December 24, 2019NOVA SCOTIA INTERNATIONAL TRADE 2018 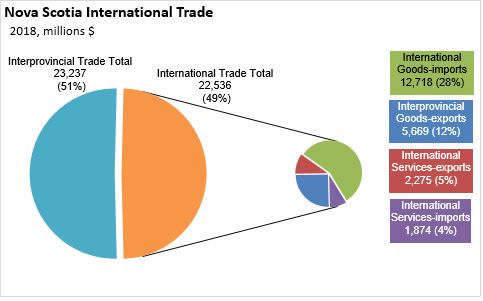
The trade data in the economic accounts represent provincial total and net expenditures in interprovincial (intP) and international (intN) markets. As there are important differences in the characteristics of intN and intP markets, it is useful to provide a separate analysis. In this note, the focus is on international (intN) trade.
Several components of intN trade are considered separately and in combination. These include exports (E), imports (I), goods (G), and services (S) trade. Total international trade is the sum of internatinal imports and exports, goods and services. It is the measure of total intN trade activity external to the provincial domestic market and interprovincial markets.
Total intN trade is comprised of four components. In 2018, in order by value, they are:
- International Imports of Goods: $12.718 billion
- International Exports of Goods: $5.669 billion
- International Exports of Services: $2.275 billion
- International Imports of Services: $1.874 billion
In total, Nova Scotia's international trade with other counties amounts to $22.536 billion.
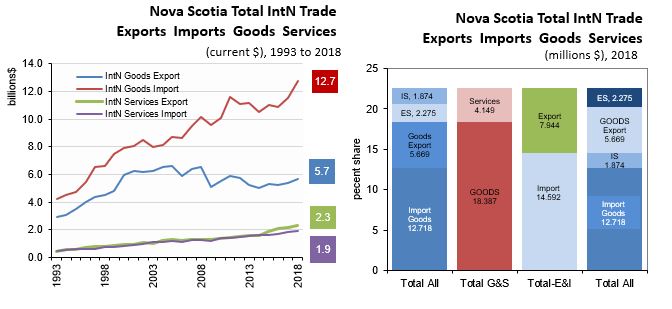
By commodity, goods are a far larger share of Nova Scotia's international trade
- International Exports and Imports of Goods amount to $18.4 billion (81.6% of total international trade)
- International Exports and Imports of Services valued at $4.1 billion (18.4% of total international trade)
In its trade with other countries, Nova Scotia imports $6.648 billion more than it exports:
- International Imports of Goods and Services amount to $14.6 billion (64.7% of total international trade)
- International Exports of Goods and Services amount to $7.9 billion (35.3% of total international trade)
INTERNATIONAL TRADE GROWTH
Between 2017 and 2018, the value of Nova Scotia's GDP increased 3.3% to $44.4 billion. All four components of Nova Scotia's International trade increased faster than nominal GDP on a year-over-year basis.
- International Imports of Goods increased 10.0%.
- International Exports of Goods increased 5.9%.
- International Exports of Services increased 4.7%.
- International Imports of Services increased 3.5%
Between 2010 to 2018, Nova Scotia's nominal GDP grew at a Compound Annual Growth Rate of 2.3 per cent per year.
- International Exports of Services increased 6.6% per year
- International Imports of Services increased 3.8% per year
- International Imports of Goods increased 3.0% per year
- International Exports of Goods increased 0.3% per year
Three of four components of international trade increased faster than nominal GDP on a long-term basis (2010 to 2018), with the exception of international goods exports.
Statistics Canada Tables 36-10-0222-01
<--- Return to Archive