The Economics and Statistics Division maintains archives of previous publications for accountability purposes, but makes no updates to keep these documents current with the latest data revisions from Statistics Canada. As a result, information in older documents may not be accurate. Please exercise caution when referring to older documents. For the latest information and historical data, please contact the individual listed to the right.
<--- Return to Archive
For additional information relating to this article, please contact:
December 13, 2019CANADA NATIONAL BALANCE SHEET ACCOUNTS, Q3 2019 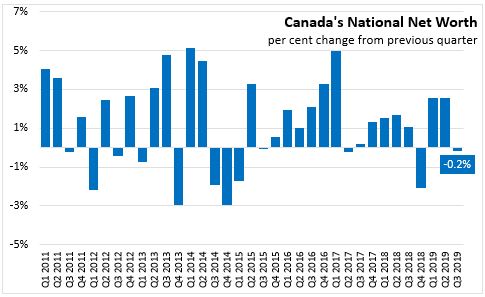
In the second quarter of 2019, Canadian national wealth declined 0.2 per cent (or $20.6 billion) to $11,783.3 billion. This follows a revised increase of 2.5 per cent in the second quarter of 2019. As with the previous quarter, growth was largely attributable to an increase in the value of natural resource assets. Residential asset values increased by 1.0 per cent while net foreign assets increased as international assets grew faster than international liabilities.
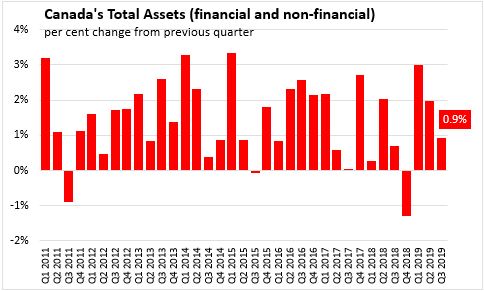
Total assets, including financial and non-financial assets increased by 0.9 per cent to $44,978 billion at the end of Q3 2019.
Household sector
In Q3 2019, Canada’s household sector net worth rose by 101.4 billion to $11,485.4 billion. Financial assets rose $88.1 billion, as it benefitted from revaluations in mutual funds and life insurance and pensions.
Household borrowing increased to $28.5 billion in Q3 2019 compared to $21.7 billion in Q2. Consumer credit and non-mortgage lending rose to $10.0 billion in total while mortgage lending increased to $18.5 billion.
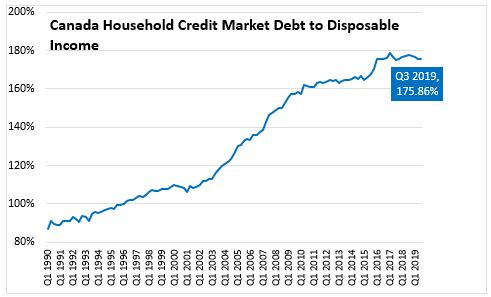
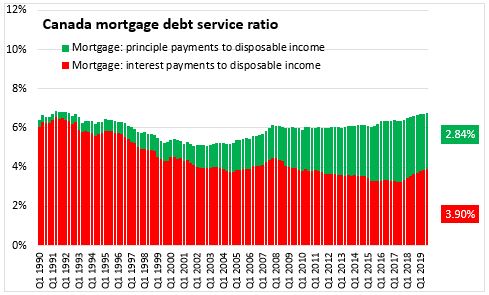
Household credit market debt as a proportion of household disposable income increased slightly to 175.9 per cent in Q3 2019.
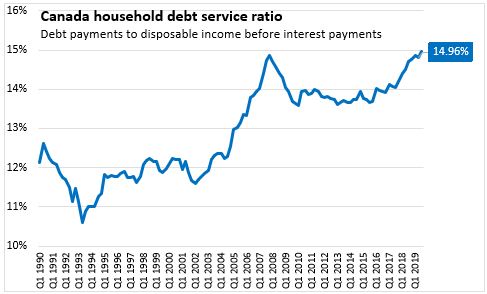
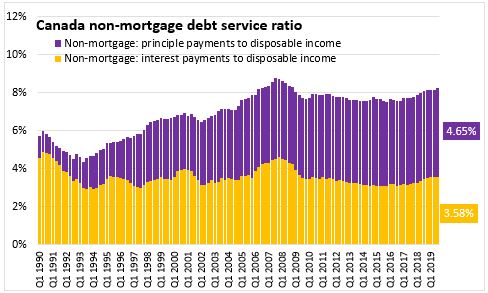
Household debt payments rose from 14.82 per cent to 14.96 per cent of disposable income (before interest payments), surpassing the previous high posted in the fourth quarter of 2007. However, there is a markedly different composition of debt service obligations for Canadian households as obligated principal payments have risen over the last 12 years while interest payments as a share of disposable income have fallen. Recent interest rate increases can explain most of the recent increase in Canada's debt service ratio.
Government sector
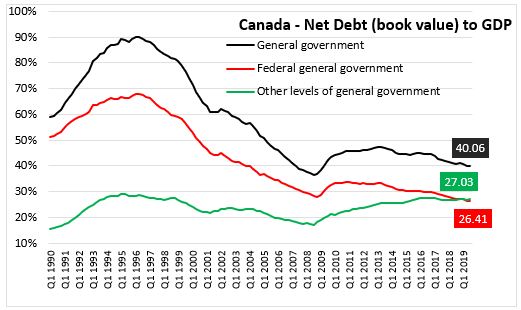
At the end of Q3 2019, general government net debt (book value) rose to 40.06 per cent of GDP. The federal government's net debt to GDP ratio continues to fall, dropping to 26.41 per cent. Net debt of other levels of government is now larger than Federal government debt at 27.03 per cent of GDP.
Corporate sector
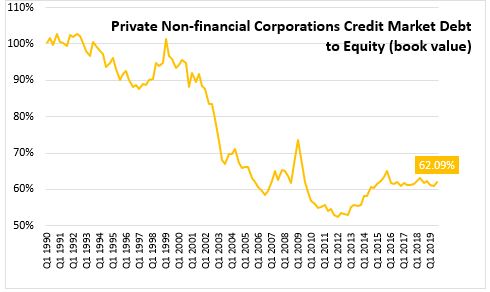
The credit market debt to equity ratio of non-financial private corporations rose to 62.09 cents of credit market debt for every dollar of equity in the Q3 2019, up from 60.82 cents (revised) in Q2 2019.
Statistics Canada:
Table 11-10-0065-01 Debt service indicators of households, national balance sheet accounts
Table 36-10-0580-01 National Balance Sheet Accounts (x 1,000,000)
Table 38-10-0235-01 Financial indicators of households and non-profit institutions serving households, national balance sheet accounts
Table 38-10-0236-01 Financial indicators of corporate sector, national balance sheet accounts
Table 38-10-0237-01 Financial indicators of general government sector, national balance sheet accounts
Table 38-10-0238-01 Household sector credit market summary table, seasonally adjusted estimates
<--- Return to Archive