The Economics and Statistics Division maintains archives of previous publications for accountability purposes, but makes no updates to keep these documents current with the latest data revisions from Statistics Canada. As a result, information in older documents may not be accurate. Please exercise caution when referring to older documents. For the latest information and historical data, please contact the individual listed to the right.
<--- Return to Archive
For additional information relating to this article, please contact:
December 05, 2019CANADIAN HOUSING STATISTICS PROGRAM, 2018 Statistics Canada released new data today from the Canadian Housing Statistics Program (CHSP) which provide insight into the household characteristics of property owners in Nova Scotia, Ontario and British Columbia. Today’s release also includes data on claimants of the home buyers’ amount (HBA), a federal incentive program for first-time home buyers linked from the T1 Family File.
First-time buyers
In Nova Scotia, 3,460 homeowners claimed the HBA in 2018, accounting for 1.3 per cent of all single-property homeowners. A similar share of homeowners claimed the HBA in Ontario (1.2 per cent) and British Columbia (1.3 per cent).
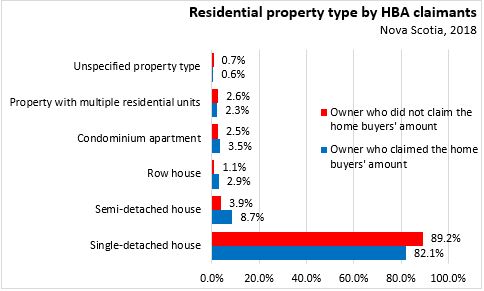
In Nova Scotia among homeowners who claimed the HBA, the largest share owned single-detached dwellings (82.1 per cent), followed by semi-detached (8.7 per cent) and condominium apartments (3.5 per cent). First-time buyers who claimed the HBA were more likely to own a semi-detached, row house, or condominium apartment compared to homeowners who did not claim the HBA in 2018.
HBA claimants are first-time homeowners who used the incentive in 2018, while those who did not use the HBA largely represents established homeowners. Those who claimed the HBA in 2018 had a median age of 31 in Nova Scotia and Ontario and 33 in British Columbia. The median age of homeowners who did not claim the HBA was at least 20 years higher in all three provinces (55 in Nova Scotia, 54 in Ontario and 56 in British Columbia in 2018).
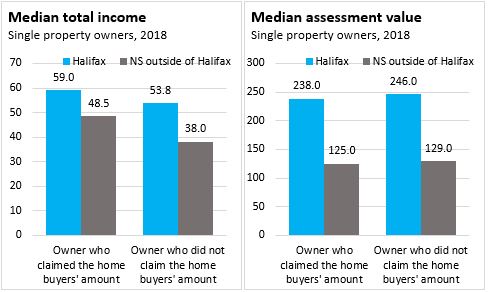
Just over half (53.8 per cent) of those who claimed the HBA in 2018 were in Halifax. The median assessment value of these homes was lower in Halifax and Nova Scotia outside of Halifax compared to assessment values of homes owned by those who did not claim the HBA in 2018. However, median incomes of homeowners who claimed the HBA were higher than median incomes of owners who did not claim the HBA in 2018. Note that these results reflect those who did not claim the HBA in 2018 and are largely established homeowners.
Characteristics of homeowners
Today’s release also includes data on the individual and family characteristics of homeowners.
In Nova Scotia, residential property owners were just as likely to be employed (68.9 per cent) than those who did not own properties (69.9 per cent) in 2018. Residential property owners were more likely to be married (75.6 per cent) compared to those who did not own properties (30.0 per cent). The median age of homeowners was 56 compared to 37 for those who were not homeowners.
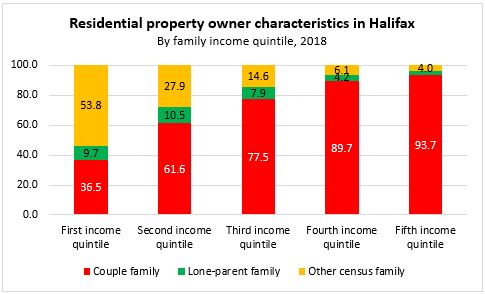
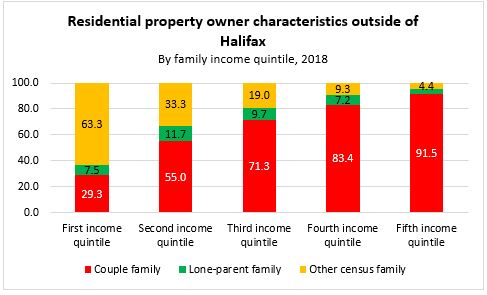
The largest share of homeowners are couple families. In Halifax, 71.8 per cent of homeowners are couple families and outside of Halifax, 66.1 per cent of homeowners are couple families. Couple families represent the largest share of homeowners in every income quintile except for the lowest quintile. Lone parent families represent a much smaller share of homeowners across the province at 7.0 per cent.
Other census family types represent the second largest type of homeowner, representing those that may be living alone, with a family to whom they are related, with a family to whom they are unrelated or with other persons not in census families. They represent the largest share of homeowners in the lowest income quintile, both in Halifax and outside of Halifax.
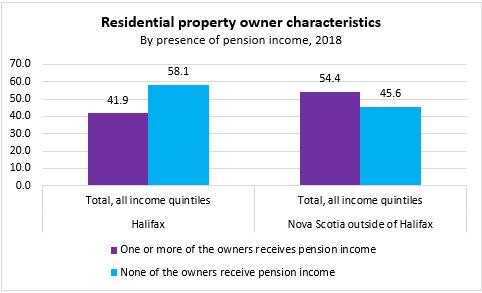
Homeowners outside of Halifax are more likely to be receiving pension income than those living in Halifax.
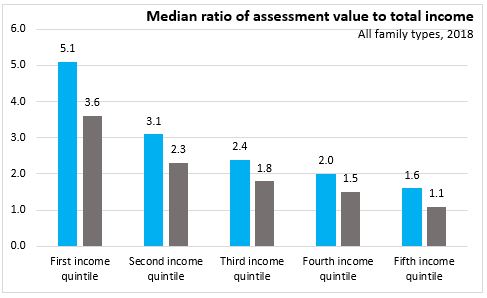
The ratio of assessment value to total family income provides a comparison of property values to income. Note that this represents a snapshot in time and is a distinct measure from affordability. It does not consider wealth, past or unreported income, financial assistance from relatives, or the price paid at the time of purchase or if the property was mortgage free.
The median ratio of assessment value to total family income was 2.4 per cent in Halifax and 1.8 per cent outside of Halifax in 2018. The ratio was highest for the lowest income quintiles and lowest in the top quintile. In Halifax, the ratio is higher for every income quintile and family type compared to the ratio in Nova Scotia outside of Halifax.
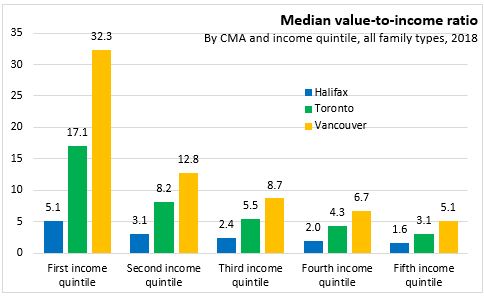
Vancouver (9.1 per cent) and Toronto (5.7 per cent) have higher assessment values relative to total income compared to Halifax. This value-to-income ratio is much higher in the lowest income quintiles.
Source: Statistics Canada.
Table 46-10-0047-01 Total income and characteristics of owners and tax filers who do not own residential property
Table 46-10-0048-01 Total income and characteristics of single-property owners by home buyers’ amount (HBA) claimant status
Table 46-10-0049-01 Total family income and owner characteristics at the residential property level
Table 46-10-0050-01 Total family income and owner characteristics at the residential property level by income quintiles
<--- Return to Archive