The Economics and Statistics Division maintains archives of previous publications for accountability purposes, but makes no updates to keep these documents current with the latest data revisions from Statistics Canada. As a result, information in older documents may not be accurate. Please exercise caution when referring to older documents. For the latest information and historical data, please contact the individual listed to the right.
<--- Return to Archive
For additional information relating to this article, please contact:
October 10, 2019UK TRADE BALANCE, AUGUST 2019 UK import and export trade is a main contributor to the overall economic growth of the UK.
Month-over-month
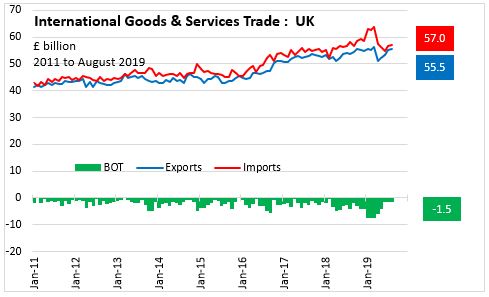
In August 2019, the UK seasonally adjusted goods & services trade deficit narrowed by £0.1 billion to £1.5 billion over Jul 2019. Goods & services Exports increased 0.9% (£0.5 billion) to £55.5 billion. Goods & services Imports increased 0.6% (£0.4 billion) to £57.0 billion.
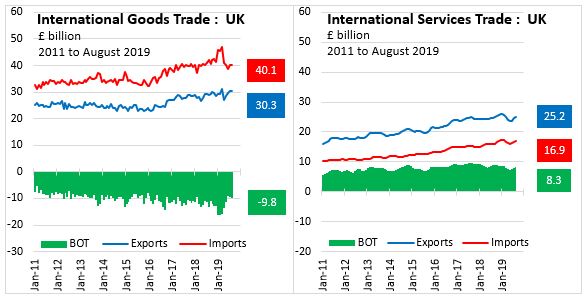
In August 2019, the UK seasonally adjusted Goods Exports decreased 0.5% (£0.2 billion) to £30.3 billion. Goods Imports increased 0.1% (£0.03 billion) to £40.1 billion. The resulting Goods BOT deficit widened by £0.2 billion to £9.8 billion over Jul 2019.
In August 2019, the UK seasonally adjusted Services Exports increased 2.6% (£0.6 billion) to £25.2 billion. Services Imports increased 2.0% (£0.3 billion) to £16.9 billion. The resulting Services BOT surplus widened by £0.3 billion to £8.3 billion over Jul 2019.
UK International Trade EU and Non-EU
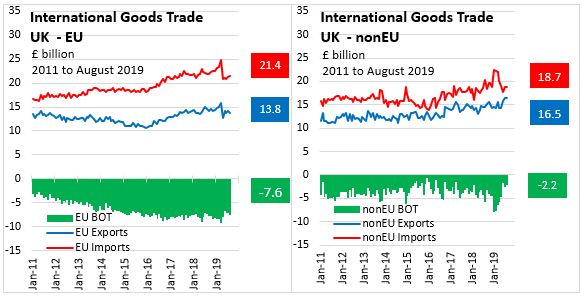
In August 2019, United Kingdom goods exports to the European Union (EU28) decreased 2.1% (£0.294 billion) to £13.8 billion, while goods imports from the European Union increased 1.0% (£0.221 billion) to £21.4 billion. The resulting goods deficit widened by 7.3% (£0.515 billion) to £7.6 billion.
In August 2019, United Kingdom goods exports with non-European Union countries increased 0.9% (£0.144 billion) to £16.5 billion, while goods imports from non-EU28 countries decreased 1.0% (£0.190 billion) to £18.7 billion. The resulting goods deficit narrowed by 13.1% (£0.334 billion) to £2.2 billion.
Year-to-date Goods Export Trade by Sector
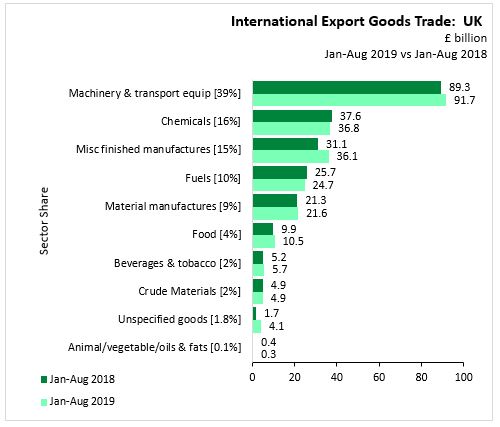
In Jan-Aug 2019 vs Jan-Aug 2018,
the following sectors increased:
- Machinery & transport equip sector, accounting for 39% of goods exports, increased 2.7% (£2.4 billion) to £91.7 billion.
- Miscellaneous finished manufactures sector, accounting for 15% of goods exports, increased 16.1% (£5.0 billion) to £36.1 billion.
- Material manufactures sector, accounting for 9% of goods exports, increased 1.6% (£0.3 billion) to £21.6 billion.
- Food sector, accounting for 4% of goods exports, increased 6.4% (£0.6 billion) to £10.5 billion.
- Beverages & tobacco sector, accounting for 2% of goods exports, increased 8.6% (£0.4 billion) to £5.7 billion.
- Unspecified goods sector, accounting for 2% of goods exports, increased 139.3% (£2.4 billion) to £4.1 billion.
and, the following sectors decreased:
- Chemicals sector, accounting for 16% of goods exports, decreased 2.2% (£0.8 billion) to £36.8 billion.
- Fuels sector, accounting for 10% of goods exports, decreased 4.2% (£1.1 billion) to £24.7 billion.
- Crude Materials sector, accounting for 2% of goods exports, decreased 1.0% (£0.05 billion) to £4.9 billion.
- Animal/vegetable/oils & fats sector, accounting for 0.1% of goods exports, decreased 5.5% (£0.020 billion) to £0.3 billion.
Year-to-date Goods Import Trade by Sector
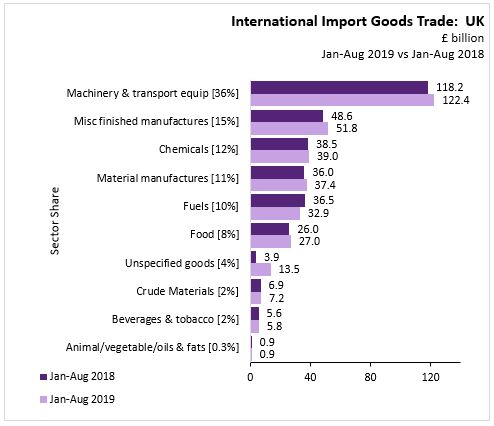
In Jan-Aug 2019 vs Jan-Aug 2018,
The following sectors increased:
- Machinery & transport equip sector, accounting for 36% of goods imports, increased 3.5% (£4.2 billion) to £122.4 billion.
- Miscellaneous finished manufactures sector, accounting for 15% of goods imports, increased 6.7% (£3.2 billion) to £51.8 billion.
- Chemicals sector, accounting for 12% of goods imports, increased 1.4% (£0.5 billion) to £39.0 billion.
- Material manufactures sector, accounting for 11% of goods imports, increased 4.0% (£1.4 billion) to £37.4 billion.
- Food sector, accounting for 8% of goods imports, increased 3.6% (£0.9 billion) to £27.0 billion.
- Unspecified goods sector, accounting for 4% of goods imports, increased 249.0% (£9.6 billion) to £13.5 billion.
- Crude Materials sector, accounting for 2% of goods imports, increased 4.3% (£0.3 billion) to £7.2 billion.
- Beverages & tobacco sector, accounting for 2% of goods imports, increased 3.9% (£0.2 billion) to £5.8 billion.
The following sectors decreased:
- Fuels sector, accounting for 10% of goods imports, decreased 9.7% (£3.5 billion) to £32.9 billion.
- Animal/vegetable/oils & fats sector, accounting for 0.3% of goods imports, decreased 1.1% (£0.01 billion) to £0.9 billion.
Year-to-date Goods Net Trade by Sector
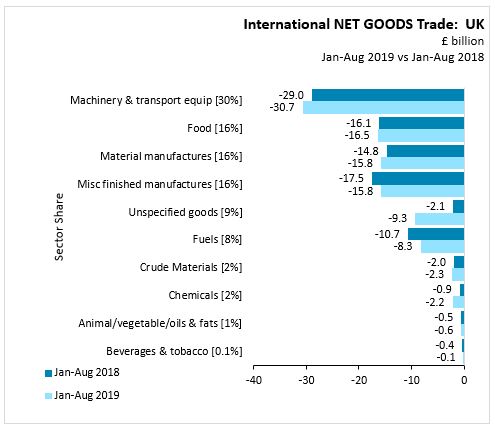
All trade sectors reported a trade deficit in Jan-Aug 2019 vs Jan-Aug 2018.
In the following sectors the deficit increased:
- Machinery & transport equip sector, accounting for 30% of net goods trade, increased 6.1% (£1.8 billion) to -£30.7 billion.
- Food sector, accounting for 16% of net goods trade, increased 1.9% (£0.3 billion) to -£16.5 billion.
- Material manufactures sector, accounting for 16% of net goods trade, increased 7.3% (£1.1 billion) to -£15.8 billion.
- Unspecified goods sector, accounting for 9% of net goods trade, increased 338.3% (£7.2 billion) to -£9.3 billion.
- Crude Materials sector, accounting for 2% of net goods trade, increased 17.5% (£0.3 billion) to -£2.3 billion.
- Chemicals sector, accounting for 2% of net goods trade, increased 157.4% (£1.4 billion) to -£2.2 billion.
- Animal/vegetable/oils & fats sector, accounting for 1% of net goods trade, increased 1.8% (£0.010 billion) to -£0.6 billion.
In the following sectors the deficit decreased:
- Miscellaneous finished manufactures sector, accounting for 16% of net goods trade, decreased 10.0% (£1.8 billion) to -£15.8 billion.
- Fuels sector, accounting for 8% of net goods trade, decreased 22.7% (£2.4 billion) to -£8.3 billion.
- Beverages & tobacco sector, accounting for 0.1% of net goods trade, decreased 62.3% (£0.23 billion) to -£0.14 billion.
Source: UK Office for National Statistics, Statistical Bulletin | Time Series | Time Series Explorer
<--- Return to Archive