The Economics and Statistics Division maintains archives of previous publications for accountability purposes, but makes no updates to keep these documents current with the latest data revisions from Statistics Canada. As a result, information in older documents may not be accurate. Please exercise caution when referring to older documents. For the latest information and historical data, please contact the individual listed to the right.
<--- Return to Archive
For additional information relating to this article, please contact:
October 08, 2019JAPAN CURRENT ACCOUNT AND TRADE BALANCE, AUGUST 2019 Current Account
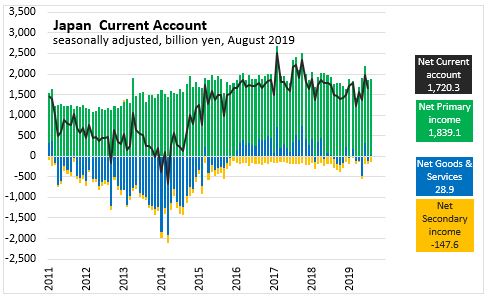
In August 2019 vs July 2019, Japan reported
- Goods & services trade changed from a deficit (107 billion yen) to a surplus (29 billion yen)
- Primary income surplus narrowed by 5 billion yen to 1,839 billion yen
- Secondary income deficit widened by 58 billion yen to 148 billion yen
- As a result, Current account surplus widened by 73 billion yen to 1,720 billion yen.
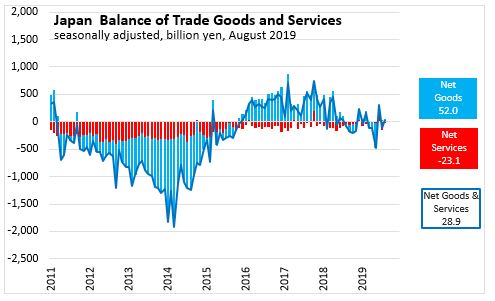
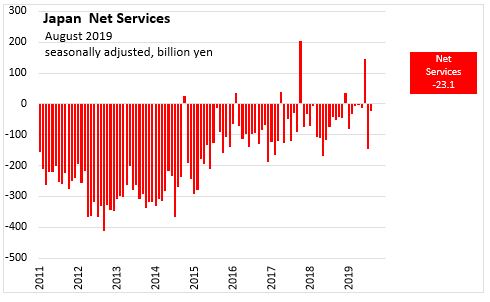
Trade Balance
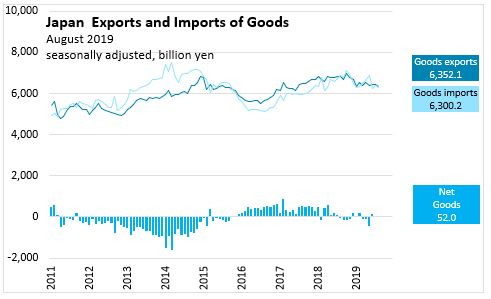
In August 2019 vs July 2019, Japan 's
- Export goods trade surplus narrowed by 68 billion yen to 6,352 billion yen
- Import goods trade surplus narrowed by 82 billion yen to 6,300 billion yen
- As a result, Net Goods trade surplus widened by 14 billion yen to 52 billion yen.
- Net Services trade deficit narrowed by 122 billion yen to 23 billion yen
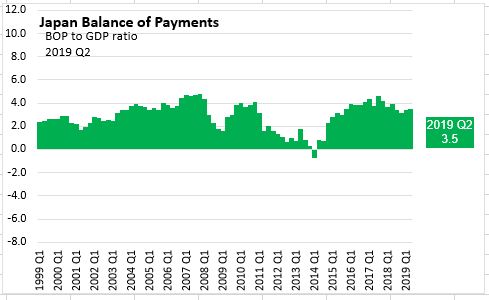
CURRENT ACCOUNT AS A SHARE OF GDP
The ratio of the current account balance to the Gross Domestic Product (or % of GDP) provides an indication of the country's trade and income flows relative to the state of the economy. The ratio is calculated by dividing the net values of exports less imports, primary income (interest and dividends) and secondary income (transfers) over a period by the gross domestic product for the same period. Although called a ratio, it is usually expressed as a percentage. A current account surplus indicates upward pressure on the foreign exchange rate unless it is offset by net outflows (lending, acquisition of assets) outside the country.
In the period 1999 Q1 to 2007 Q4, Japan’s current account to GDP measure was positive, ranging from 1.7% to 4.8%.
With the recession in 2008-2009, Japan’s current account to GDP measure declined to a low of 1.6% in 2009 Q1 but quickly recovered to a local high of 4.1% in 2010 Q4.
Over the next 13 quarters (2010 Q4 to 2014 Q1), Japan’s current account to GDP measure declines 4.8 points to -0.7%.
Over the next 14 quarters (2014 Q1 to 2017 Q3), Japan’s current account to GDP measure recovered to a new local high of 4.6% in 2017 Q3.
In the period to 2019 Q2, Japan’s current account to GDP measure has declined 1.1 points to 3.5%.
Report | Press Release | Balance of Payments
Based on Table 6s-a-2 Current Account (seasonally adjusted), Monthly
OECD BOP as a % of GDP
<--- Return to Archive