The Economics and Statistics Division maintains archives of previous publications for accountability purposes, but makes no updates to keep these documents current with the latest data revisions from Statistics Canada. As a result, information in older documents may not be accurate. Please exercise caution when referring to older documents. For the latest information and historical data, please contact the individual listed to the right.
<--- Return to Archive
For additional information relating to this article, please contact:
October 04, 2019NOVA SCOTIA - INTERNATIONAL MERCHANDISE TRADE AUGUST 2019 Year-to-Date (Jan-Aug 2019 vs. Jan-Aug2018, customs-based, unadjusted)
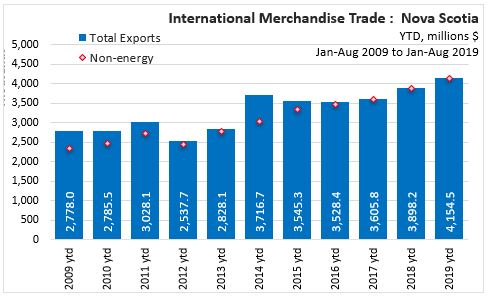
In Jan-Aug 2019, Nova Scotia International Merchandise Trade Exports increased 6.6% ($256.2 million) over Jan-Aug 2018, to $4.2 billion.
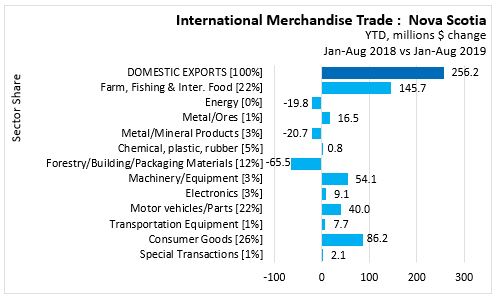
YTD - By Sector
Comparing Nova Scotia's exports for Jan-Aug 2019 with the same period last year the largest dollar value increases were in Farm, Fishing & Inter. Food ($145.7 million), Consumer Goods ($86.2 million), Machinery/Equipment ($54.1 million). The largest dollar value decreases were in Forestry/Building/Packaging Materials ($65.5 million), Metal/Mineral Products ($20.7 million), and Energy ($19.8 million).
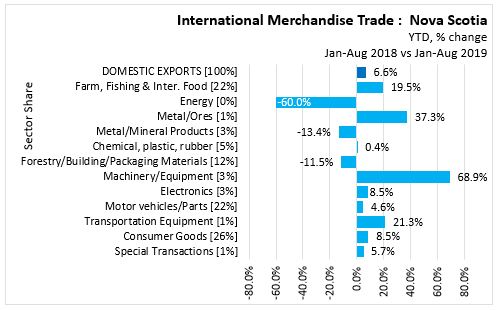
On a year-to-date basis, export values increased in
- Machinery/Equipment by 68.9% ($54.1 million)
- Metal/Ores by 37.3% ($16.5 million)
- Transportation Equipment by 21.3% ($7.7 million)
- Farm, Fishing & Inter. Food by 19.5% ($145.7 million)
- Consumer Goods by 8.5% ($86.2 million)
- Electronics by 8.5% ($9.1 million)
- Special Transactions by 5.7% ($2.1 million)
- Motor vehicles/Parts by 4.6% ($40.0 million)
- Chemical, plastic, rubber by 0.4% ($0.8 million)
and export values decreased in
- Forestry/Building/Packaging Materials by 11.5% (-$65.5 million)
- Metal/Mineral Products by 13.4% (-$20.7 million)
- Energy by 60% (-$19.8 million)
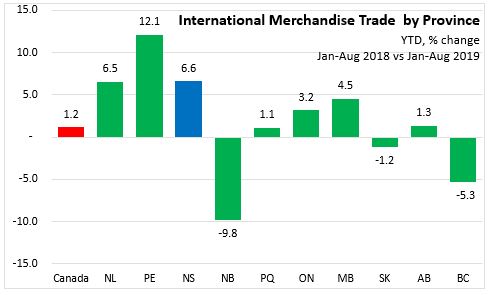
YTD by Province
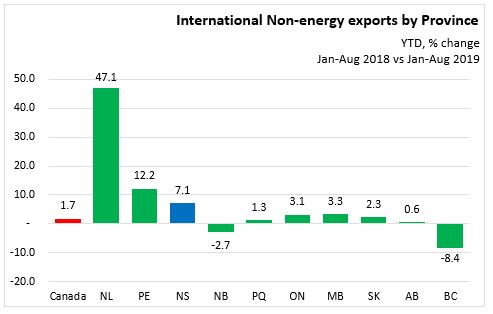
In Jan-Aug 2019, Prince Edward Island reported the highest increase (12.1%), while New Brunswick reported the highest decline (9.8%) in merchandise trade exports over Jan-Aug 2018. Nova Scotia reported a 6.6% gain in merchandise trade exports. Canada reported a 1.2% gain in merchandise trade exports over Jan-Aug 2018.
Excluding energy exports, Newfoundland and Labrador reported the highest increase (47.1%) while British Columbia reported the highest decline (8.4%) in Non-energy exports over Jan-Aug 2018. Nova Scotia reported a 7.1% gain in Non-energy exports. Canada reported a 1.7% gain in Non-energy exports over Jan-Aug 2018.
.
YTD EXPORTS BY INTERNATIONAL DESTINATION
All countries
Nova Scotia’s trade continues to diversity.
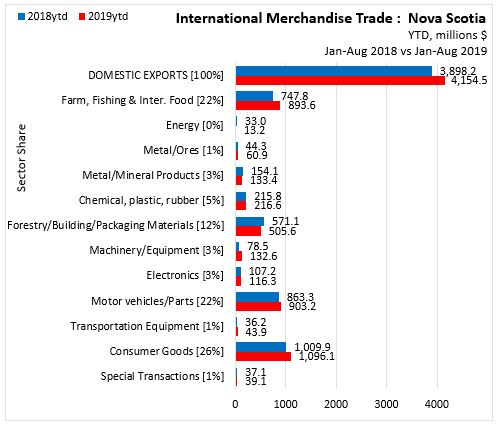
In Nova Scotia Jan-Aug 2019, international export trade to all countries increased 6.6% to $4,154.5 million over Jan-Aug 2018.
- Consumer Goods led the way with a value of $1,096.1 million (26 % share), followed by
- Motor vehicles/Parts with a value of $903.2 million (22 % share),
- Farm, Fishing & Inter. Food with a value of $893.6 million (22 % share),
- Forestry/Building/Packaging Materials with a value of $505.6 million (12 % share),
- Chemical, plastic, rubber with a value of $216.6 million (5 % share),
- Metal/Mineral Products with a value of $133.4 million (3 % share),
- Machinery/Equipment with a value of $132.6 million (3 % share),
- Electronics with a value of $116.3 million (3 % share),
- Metal/Ores with a value of $60.9 million (1 % share),
- Transportation Equipment with a value of $43.9 million (1 % share),
- Special Transactions with a value of $39.1 million (1 % share), and,
- Energy with a value of $13.2 million (> 1 % share),
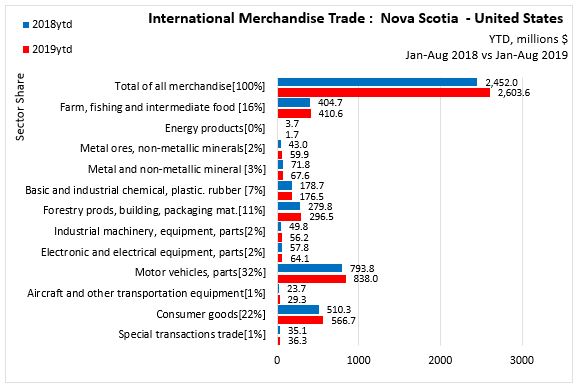
In the period Jan-Aug 2018 vs Jan-Aug 2019, year-to-date export trade to the United States increased 6.2% ($151.7 million) to $2,603.6 million. The United States share of total Nova Scotia exports was 62.7%.
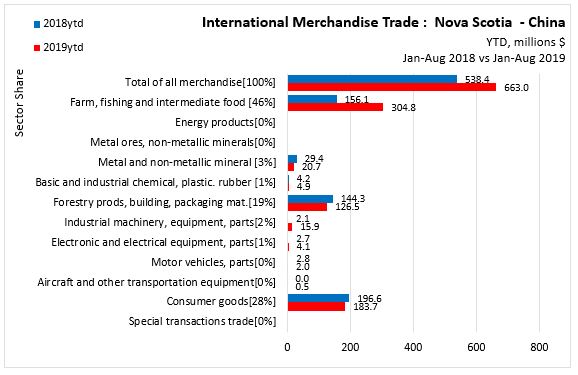
Year-to-date export trade to China increased 23.1% ($124.6 million) to $663.0 million. China's share of total Nova Scotia exports was 16.0%.
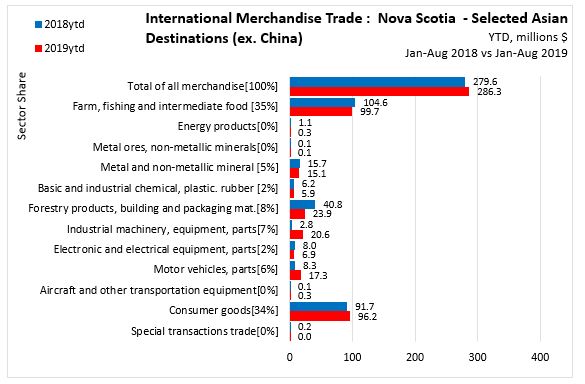
Year-to-date export trade to selected Asia countries (excluding China) increased 2.4% ($6.7 million) to $286.3 million. Japan up $1.7 million to $65.9 million; South Korea up $14.4 million to $84.1 million; Hong Kong up $3.1 million to $58.1 million; India up $2.0 million to $23.2 million; Taiwan down -$6.5 million to $10.3 million; Indonesia down $18.8 million to $16.2 million; Singapore up $10.82 million to $28.6 million; Other Major Asian share of total Nova Scotia exports was 6.9%.
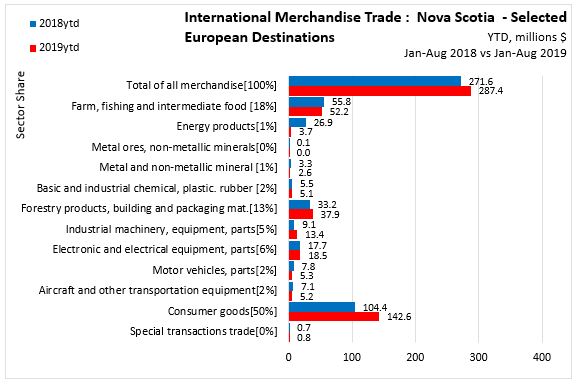
Year-to-date export trade to selected Europe countries decreased 5.8% ($15.8 million) to $287.4 million. United Kingdom up $5.5 million to $61.3 million; Germany up $12.9 million to $39.5 million; Italy up $2.3 million to $12.4 million; France up $11.4 million to $60.8 million; Netherlands down $17.2 million to $51.4 million; Belgium up $6.5 million to $30.3 million; Spain down $5.6 million to $31.9 million; Major European countries share of total Nova Scotia exports was 6.9%
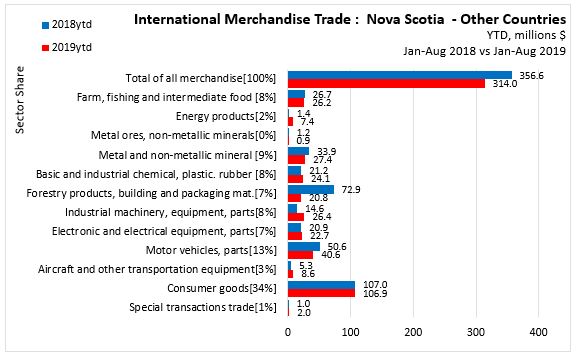
Year-to-date export trade to Other countries decreased -11.9% (-$42.6 million) to $314.0 million. Algeria down $0.6 million to $0.02 million; Australia down $18.8 million to $13.1 million; Brazil up $1.4 million to $10.2 million; Iraq up $0.4 million to $3.8 million; Mexico down $7.1 million to $44.6 million; Norway up $2.0 million to $14.1 million; Peru down $0.4 million to $0.47 million; Russian Federation up $0.5 million to $2.9 million; Switzerland up $1.6 million to $5.8 million; Saudi Arabia down $1.3 million to $0.7 million; Turkey down $11.7 million to $5.0 million; Residual down $8.5 million to $213.3 million. Other countries share of total Nova Scotia exports was 7.6%.
Statistics Canada Links
12-10-0119-01 International merchandise trade: Nova Scotia sectors
12-10-0119-01 International merchandise trade: by province and commodity
12-10-0119-01 International merchandise trade: by province and energy commodity
12-10-0119-01 International merchandise trade: by province, commodity, trading partners
Trading partners group 1: All, US, China
Trading partners group 2: Japan et al
Trading partners group 3: UK et al
Trading partners group 4: Mexico et al
<--- Return to Archive