The Economics and Statistics Division maintains archives of previous publications for accountability purposes, but makes no updates to keep these documents current with the latest data revisions from Statistics Canada. As a result, information in older documents may not be accurate. Please exercise caution when referring to older documents. For the latest information and historical data, please contact the individual listed to the right.
<--- Return to Archive
For additional information relating to this article, please contact:
October 03, 2019POLICE RESOURCES 2018 
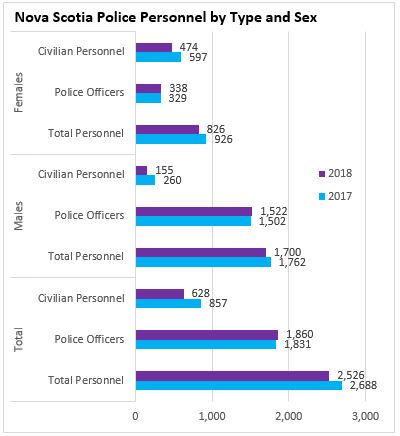
Nova Scotia had 2,526 police personnel in 2018, down 6 per cent from 2,688 in 2017. There were 1,860 police officers in the province in 2018, with 666 other police personnel (mainly civilian positions).
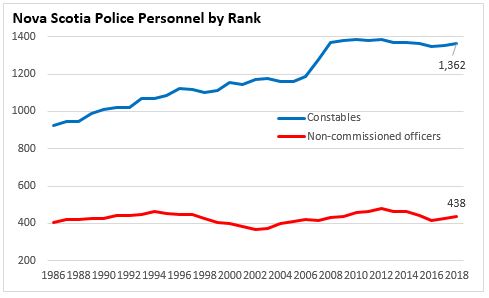
In 2018 there were 438 non-commissioned officer positions in Nova Scotia. The number of non-commissioned officer positions has remained relatively stable since 1986. The number of constables in Nova Scotia increased from 1986 to 2008, with a notable rise from 2006-2008. Since 2008 the number of constables has been relatively stable, with 1,362 constables in 2018.
There number of police officers per 100,000 persons has declined across all provinces since 2010. After declining steadily for five years, the number of officers per person in 2018 increased 0.6 per cent in Nova Scotia.
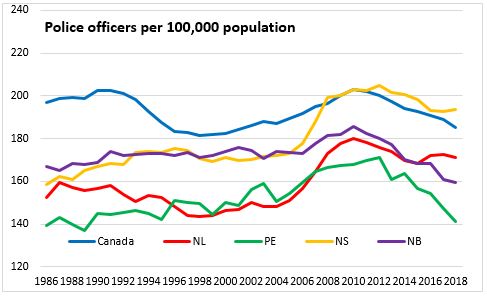
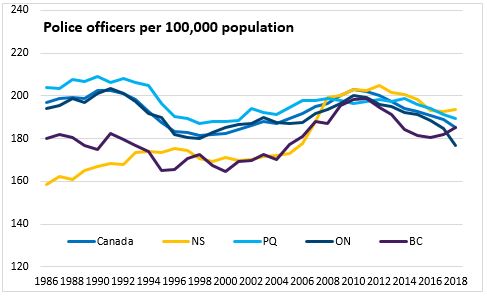
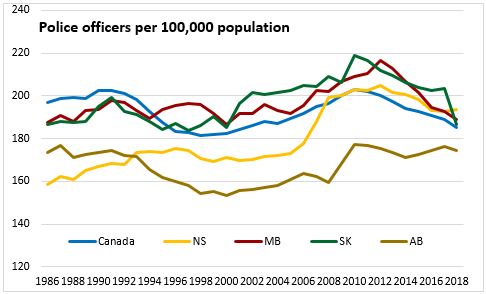
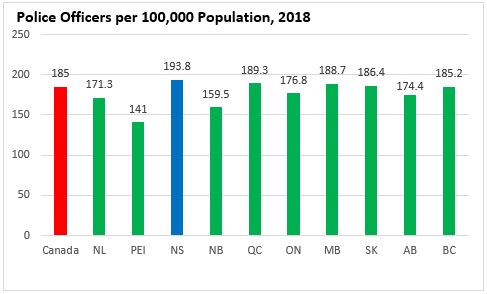
There were 185 police officers per 100,000 persons in Canada in 2018, while Nova Scotia averaged approximately 194 per 100,000. In 2018, the highest rates of officers per person were found in Nova Scotia, Quebec, and Manitoba , while Prince Edward Island and New Brunswick had the lowest rates.
Across Nova Scotia’s municipal police services, Annapolis Royal, New Glasgow and Truro had the high rates of officers per person.

Criminal Code Incidents per Officer
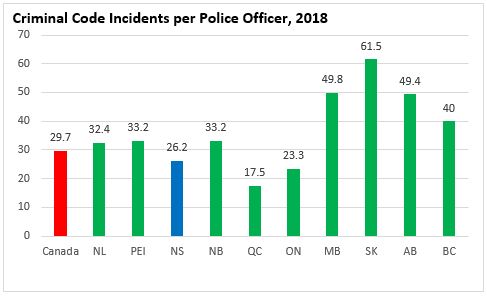
For both Nova Scotia and Canada, the number of criminal code incidents per office has been on a downward trend since 1986, although rates have increased in recent years nationally. In 2018, there were 29.7 criminal code incidents per officer in Canada, up 4.2 per cent from 2017. In Nova Scotia the number of incidents per officer was 26.2, virtually unchanged from the previous year.
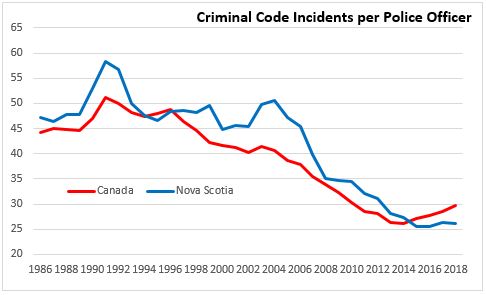
The highest rates of criminal code incidents per officer in 2018 were in Manitoba, Saskatchewan and Alberta, while Nova Scotia, Ontario and Quebec had the lowest rates.
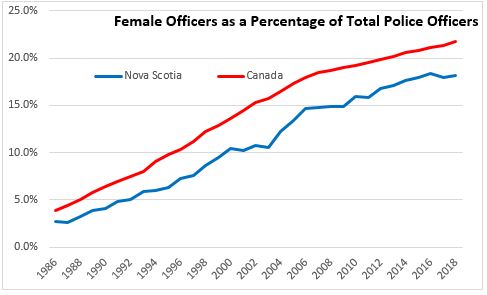
Females Officers
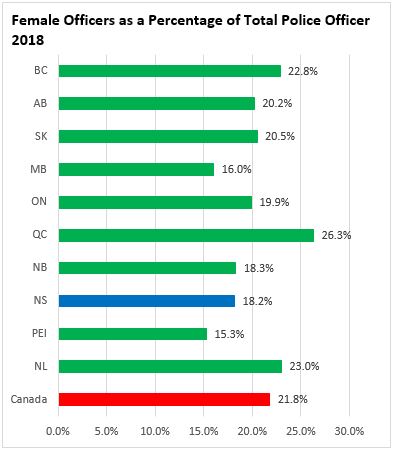
The number of female officers in Canada and Nova Scotia has been on the rise since 1986. In Canada, 21.8 per cent of officers were female in 2018, up from only 3.9 per cent in 1986. In Nova Scotia, female officers have accounted for just over 18 per cent of all officers since 2015, compared to only 2.7 per cent in 1986.
Quebec, British Columbia and Newfoundland and Labrador had the highest proportion of female officers in Canada in 2018, while Prince Edward Island and Manitoba had the lowest share of officers that were female.
Source: Statistics Canada.
Table 35-10-0076-01 Police personnel and selected crime statistics
Table 35-10-0077-01 Police personnel and selected crime statistics, municipal police services
Table 35-10-0078-01 Police personnel by detailed rank, duties and gender
<--- Return to Archive