The Economics and Statistics Division maintains archives of previous publications for accountability purposes, but makes no updates to keep these documents current with the latest data revisions from Statistics Canada. As a result, information in older documents may not be accurate. Please exercise caution when referring to older documents. For the latest information and historical data, please contact the individual listed to the right.
<--- Return to Archive
For additional information relating to this article, please contact:
September 10, 2019PROVINCIAL AND TERRITORIAL GREENHOUSE GAS EMISSIONS, 2017 Statistics Canada has updated data for greenhouse gas (GHG) emissions at the provincial and territorial level through 2017. Statistics Canada notes:
"Statistics Canada's physical flow accounts (PFA) record the annual flows of selected natural resources, products and residuals between the Canadian economy and the environment. As such, data are presented to reflect the activities of industries, households and governments, and they follow the classification system of industries and commodities used in Statistics Canada's supply and use tables.
"Environment and Climate Change Canada (ECCC) is responsible for producing Canada's National Inventory Report on Greenhouse Gas Sources and Sinks(NIR). This inventory fulfills Canada's reporting obligations under the United Nations Framework Convention on Climate Change (UNFCCC), and is the official benchmark for greenhouse gas (GHG) emissions in Canada.
"Despite drawing from common sources, the estimates in Statistics Canada's GHG emissions account differ from those reported in the NIR. This is because the reporting requirements of the UNFCCC differ from the methodological guidelines of the United Nations System of Environmental–Economic Accounting, which is used to create the GHG account described in this article. The sector definitions of the NIR also differ from those of the PFA and therefore should not be directly compared."
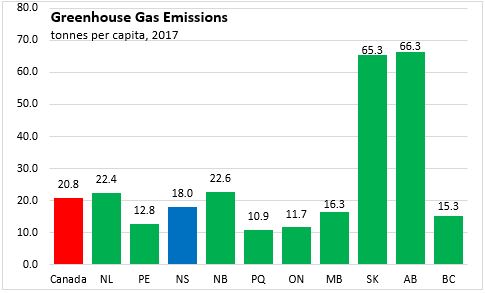
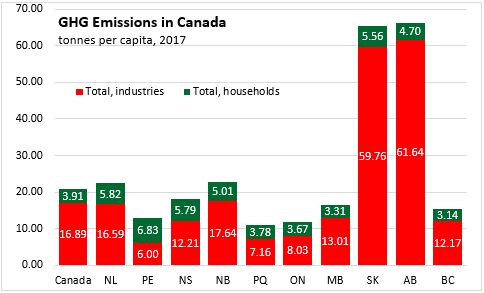
In 2017, Nova Scotian industries and households produced 18.0 tonnes of GHG emissions per capita. GHG emissions per capita were highest in Alberta (66.3 tonnes per capita) and lowest in Quebec (10.9 tonnes per capita).
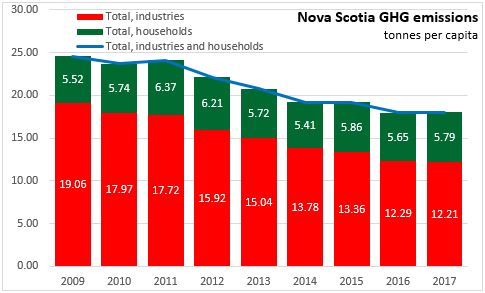
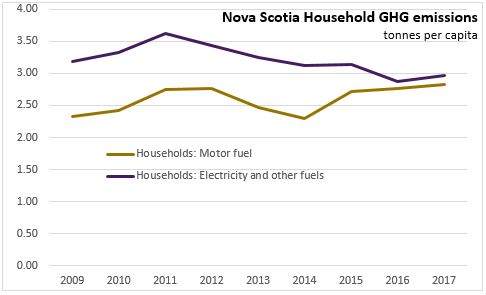
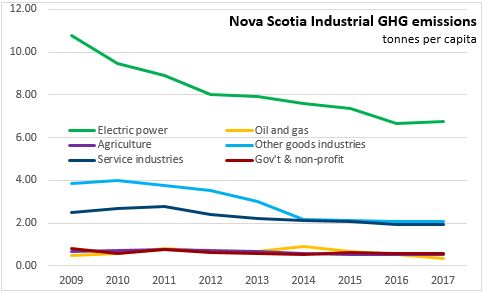
On a per capita basis, GHG emissions declined 3.8 per cent (compound annual growth rate, CAGR) in Nova Scotia from 2009 to 2017. This is largely due to declines in emissions from electric power generation and manufacturing industries. Household emissions have remained relatively constant since 2009, as declining emissions from electricity and other fuels was offset by higher emissions from motor fuels. In 2017, Nova Scotia's per capita GHG emissions increased 0.3 per cent, the same per capita pace as national average emissions growth.

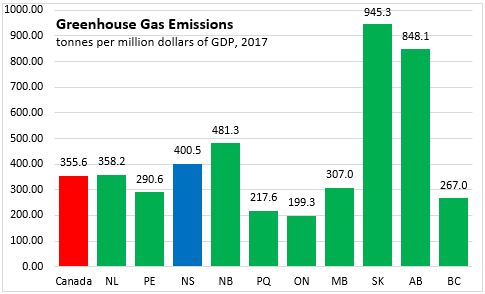
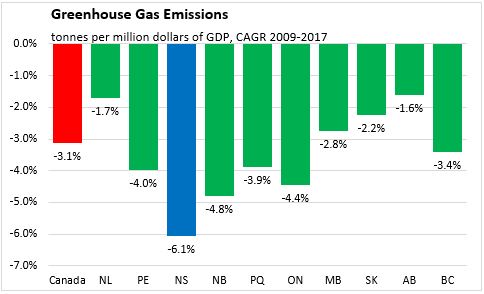
GHG emissions per million dollars of nominal GDP were highest in Saskatchewan and Alberta and lowest in Ontario and Quebec in 2016. Nova Scotia industries and households emitted 400.5 tonnes per million dollars of GDP, higher than the Canadian average of 355.6 tonnes per million dollars of GDP. GHG emissions per million dollars of GDP declined in every province from 2009 to 2017, with Nova Scotia recording the largest decline (-6.1 per cent CAGR) and Alberta (-1.6 per cent) and Newfoundland and Labrador (-1.7 per cent) recording the smallest declines.
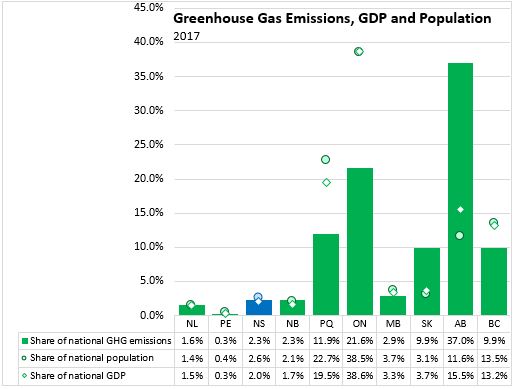
Nova Scotia's emissions amount to 2.3 per cent of national GHG emissions; less than the province's share of national population, but greater than the province's share of national GDP. Larger urban provinces - Ontario, Quebec and British Columbia - represent a lower share of national emissions than their population or GDP. Notably, these provinces, along with Manitoba have hydroelectric and nuclear power stations that generate fewer GHGs from electric power production. In Alberta and Saskatchewan, higher emissions from oil & gas extraction, agriculture, and electric power generation contribute to a higher share of national emissions than population or GDP.
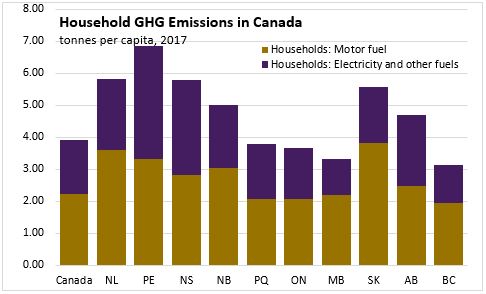
Across Canada, industrial emissions were generally larger than household emissions (except Prince Edward Island).
Differences in available fuels, climate, household size and household incomes are some of the factors that can influence household per capita emissions across the provinces. Household GHGs per capita from motor fuels (i.e. gasoline) were highest in Saskatchewan and lowest in British Columbia in 2017. British Columbia, Ontario and Quebec have a higher share of the population living in urban areas and less dependency on motor fuels. Household GHGs from electricity and other fuels were highest in the Atlantic provinces and lowest in Manitoba and British Columbia. In the Atlantic provinces, household natural gas is not widely available and other fuels are more common for heat and electricity compared to other provinces.
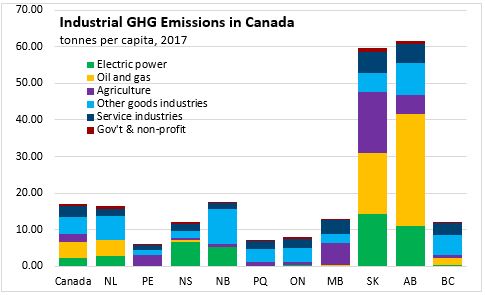
Industrial emissions account for much of the variation in emissions per capita from one province to another. The highest industrial emissions per capita were in Saskatchewan and Alberta, followed (distantly) by New Brunswick and Newfoundland and Labrador.
Industrial emissions are concentrated in three sectors of the economy: oil and gas extraction, electric power generation and agriculture.
Oil and gas extraction emissions are highest in Alberta (30.7 tonnes per capita) and Saskatchewan (16.9 tonnes per capita). Newfoundland and Labrador's oil and gas extraction sector (4.1 tonnes per capita) produces less emissions than the national average for that sector. Most other provinces have comparatively few oil and gas resources in production. Nova Scotia's oil and gas extraction generated 0.36 tonnes per capita of emissions in 2017.
Electric power emissions are highest in Saskatchewan (14.2 tonnes per capita), followed by Alberta (10.9 tonnes per capita), Nova Scotia (6.7 tonnes per capita) and New Brunswick (5.1 tonnes per capita). Many other provinces make use of hydroelectric or nuclear generation to produce power without substantial GHG emissions.
Agricultural emissions are highest in Saskatchewan (16.6 tonnes per capita) followed by Manitoba (6.1 tonnes per capita), Alberta (5.3 tonnes per capita) and Prince Edward Island (3.0 tonnes per capita). Nova Scotia's agricultural emissions per capita were 0.5 tonnes per capita.
The remainder of emissions from goods industries include substantial emissions from petroleum refining, pulp/paper, steel and chemical manufacturing. Service industry emissions include notable emissions from transportation (air, rail, water, truck) and pipelines.
Statistics Canada. Table 38-10-0097-01 Physical flow account for greenhouse gas emissions
<--- Return to Archive