The Economics and Statistics Division maintains archives of previous publications for accountability purposes, but makes no updates to keep these documents current with the latest data revisions from Statistics Canada. As a result, information in older documents may not be accurate. Please exercise caution when referring to older documents. For the latest information and historical data, please contact the individual listed to the right.
<--- Return to Archive
For additional information relating to this article, please contact:
May 16, 2019MANUFACTURING SHIPMENTS, MARCH 2019 NOVA SCOTIA
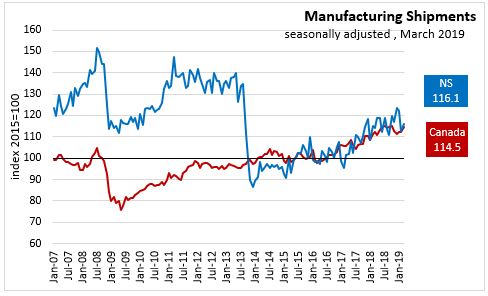
In Nova Scotia March 2019, seasonally adjusted Manufacturing Shipments increased 3.0% to $747.6 million over February 2019 and increased 1.6% over March 2018.
CANADA
In Canada March 2019, seasonally adjusted Manufacturing Shipments increased 2.1% to $58.0 billion over February 2019 and increased 2.0% over March 2018. The transportation equipment, petroleum and coal product, and primary metal industries posted the largest gains in March. Compared to February 2019, overall sales increased in 12 of 21 industries representing 56.4% of all manufacturing sectors.
Durable goods increased 2.9% to $30.9 billion over Feb 2019 and decreased 2.4% over March 2018. Non-durable goods increased 1.3% to $27.1 billion over Feb 2019 and increased 1.5% over March 2018.
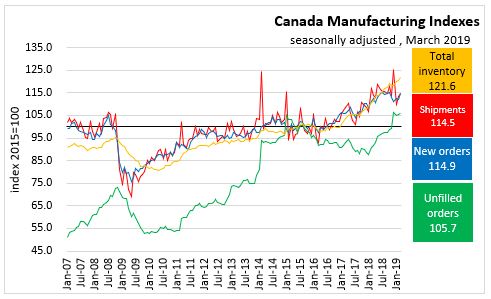
Inventory to sales ratio decreased to 1.50 in March. Unfilled orders increased 0.1% to $100.3 billion. Unfilled orders were up 0.1% to $100.3 billion despite declines in 11 of 21 industries. Aeorspace product and parts reported higher unfillled orders. Machinery industries reported the largest declines in unfilled orders. New orders increased 1.5% to $58.1 billion over February 2019 as a result of higher orders in aeorspace, petroleum/coal, and motor vehicle industries.
PROVINCES
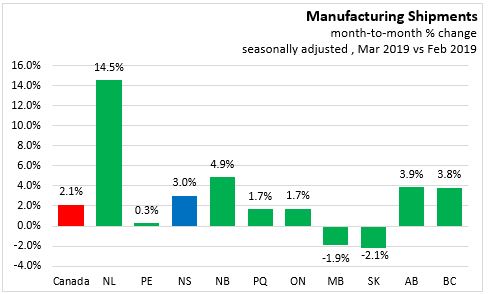
On a seasonally adjusted, month-over-month basis, Manufacturing sales increased in 8 provinces in March 2019 over February 2019. Newfoundland and Labrador had the largest growth at 14.5%. Saskatchewan shipment growth decreased 2.1%. Nova Scotia shipments increased 3.0%. In Canada shipments increased 2.1%.
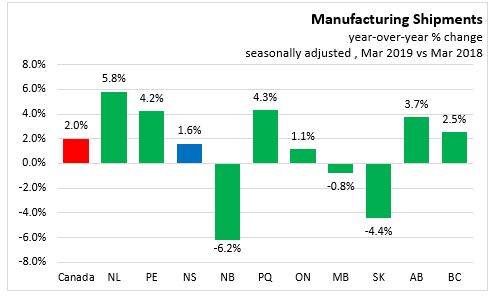
On a seasonally adjusted year-over-year basis, Manufacturing sales increased in 7 provinces in March 2019 over March 2018. Newfoundland and Labrador had the largest growth at 5.8%. New Brunswick shipment growth decreased 6.2%. Nova Scotia shipments increased 1.6%. In Canada shipments increased 2.0%.
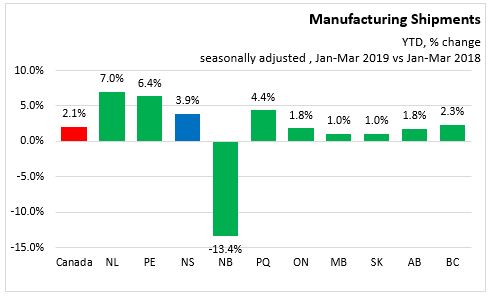
On a seasonally adjusted, year-to-date basis, Manufacturing sales increased in 9 provinces in Jan-Mar 2019. Newfoundland and Labrador had the largest growth at 7.0%. New Brunswick shipment growth only increased -13.4%. Nova Scotia shipments increased 3.9%. In Canada shipments increased 2.1%.
NOVA SCOTIA SECTORS
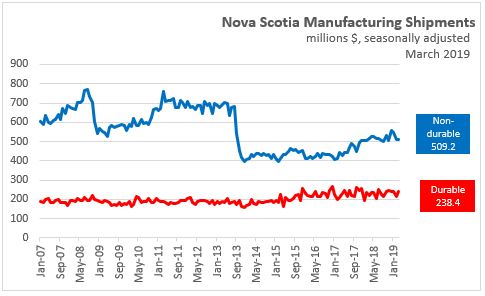
Nova Scotia manufacturing shipments have been on an upward trend since the beginning of 2014 with rising durable (i.e. wood products, metal products, machinery, transportation equipment) and non-durable (i.e. food, paper/pulp, chemical, plastic and rubber) shipments. Seasonally adjusted non-durable shipments have risen from $408 million in January 2014 to $525 million in February 2019. Durable shipments have increased from $170 million in January 2014 to $223 million in February 2019.
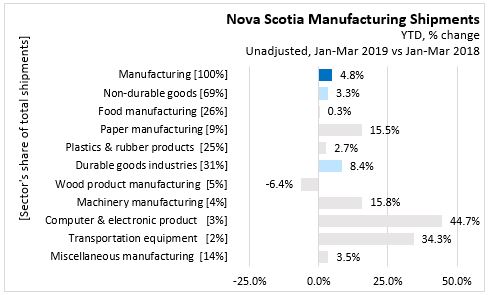
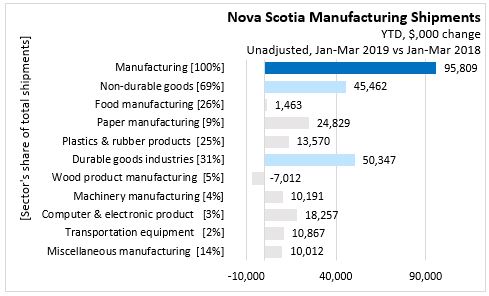
Unadjusted year-to-date (Jan-Feb 2019), Manufacturing Shipments increased 4.8% ($95.8 million) over the same period last year.
- Non-durable goods shipments, accounting for 69% of Manufacturing Shipments, increased 3.3% ($45.5 million),
- Food manufacturing with a 26% share decreased 1.1% ($1.5 million).
- Paper manufacturing, accounting for 9% of Manufacturing Shipments, increased 21.1% ($24.8 million).
- Plastics & rubber products with a 25% share increased 3.5% ($13.6 million).
- Durable goods industries with a 31% share increased 8.5% ($50.3 million).
- Wood product manufacturing with a 5% share decreased 4.5% ($7.0 million).
- Machine manuacturing with a 0.03% share decreased 29.5% ($10.2 million).
- Computer & electronics products with a 3% share inecreased 50.6% ($18.3 million).
- Transportation equipment with a 2% share increased 11.7% ($10.9 million).
- Miscellaneous manufacturing with a 14% share increased 3.9% ($10.0 million).
SOURCES
Statistics Canada Monthly survey of Manufacturing
Statistics Canada. Table 16-10-0047-01 Manufacturers' sales, inventories, orders and inventory to sales ratios, by industry (dollars unless otherwise noted)
Statistics Canada. Table 16-10-0048-01 Manufacturing sales by industry and province, monthly (dollars unless otherwise noted) (x 1,000)
<--- Return to Archive