The Economics and Statistics Division maintains archives of previous publications for accountability purposes, but makes no updates to keep these documents current with the latest data revisions from Statistics Canada. As a result, information in older documents may not be accurate. Please exercise caution when referring to older documents. For the latest information and historical data, please contact the individual listed to the right.
<--- Return to Archive
For additional information relating to this article, please contact:
April 17, 2019NOVA SCOTIA - INTERNATIONAL MERCHANDISE TRADE FEBRUARY 2019 Year-to-Date (Jan-Feb 2019 vs. Jan-Feb 2018, customs-based, unadjusted)

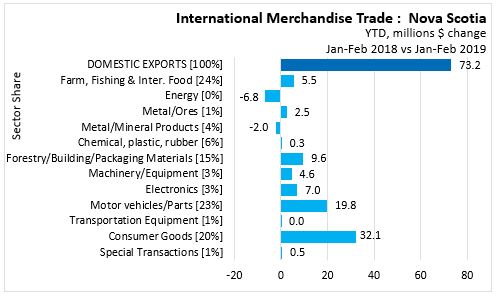
In Jan-Feb 2019, Nova Scotia International Merchandise Trade Exports increased 8.7% ($73.2 million) over Jan-Feb 2018, to $0.9 billion.
YTD - By Sector
Comparing Nova Scotia's exports for Jan-Feb 2019 with the same period last year the largest dollar value increase was in Consumer Goods ($32.1 million), Motor vehicles/Parts ($19.8 million), and Forestry/Building/Packaging Materials ($9.6 million).
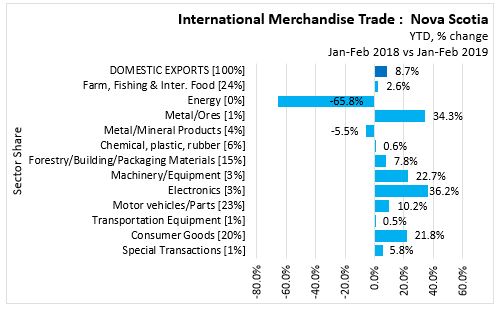
On a year-to-date basis, export values increased in
- Electronics by 36.2% ($7.0 million)
- Metal/Ores by 34.3% ($2.5 million)
- Machinery/Equipment by 22.7% ($4.6 million)
- Consumer Goods by 21.8% ($32.1 million)
- Motor vehicles/Parts by 10.2% ($19.8 million)
- Forestry/Building/Packaging Materials by 7.8% ($9.6 million)
- Special Transactions by 5.8% ($0.5 million)
- Farm, Fishing & Inter. Food by 2.6% ($5.5 million)
- Chemical, plastic, rubber by 0.6% ($0.3 million)
- Transportation Equipment by 0.5% ($0.05 million)
and declined in
- Metal/Mineral Products by -5.5% (-$2.0 million)
- Energy by -65.8% (-$6.8 million)
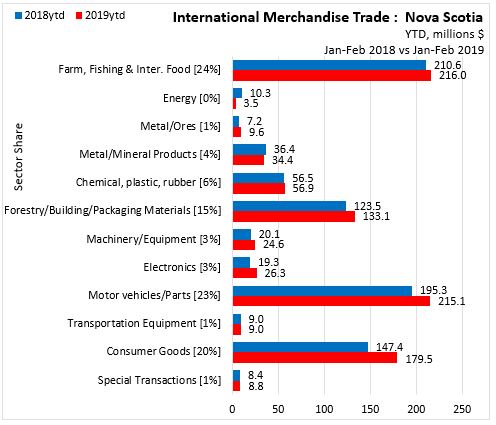
In Jan-Feb 2019
- Farm, Fishing & Inter. Food led the way with a value of $216.0 million (24 % share), followed by
- Motor vehicles/Parts with a value of $215.1 million (23 % share),
- Consumer Goods with a value of $179.5 million (20 % share),
- Forestry/Building/Packaging Materials with a value of $133.1 million (15 % share),
- Chemical, plastic, rubber with a value of $56.9 million (6 % share),
- Metal/Mineral Products with a value of $34.4 million (4 % share),
- Electronics with a value of $26.3 million (3 % share),
- Machinery/Equipment with a value of $24.6 million (3 % share),
- Metal/Ores with a value of $9.6 million (1 % share),
- Transportation Equipment with a value of $9.0 million (1 % share),
- Special Transactions with a value of $8.8 million (1 % share), and,
- Energy with a value of $3.5 million (0 % share).
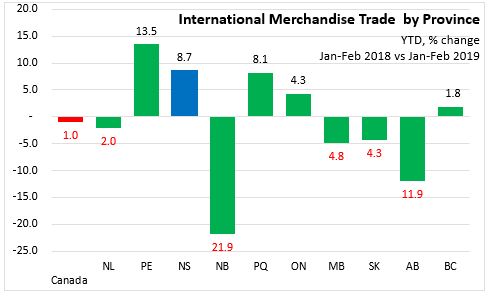
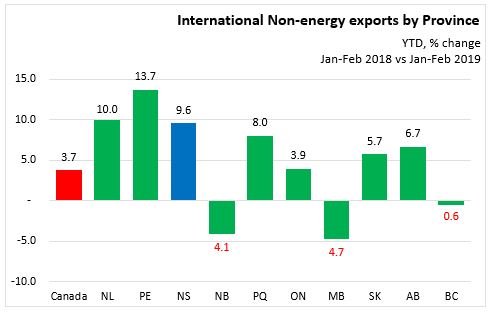
YTD by Province
In Jan-Feb 2019, Prince Edward Island reported the highest increase (13.5%) in merchandise trade exports over Jan-Feb 2018. New Brunswick reported the greatest decrease, 21.9%, in international exports. Nova Scotia reported an 8.7% gain in merchandise trade exports. Canada reported a 1.0% decline in merchandise trade exports over Jan-Feb 2018.
Excluding energy exports, Prince Edward Island reported the highest increase (13.7%) in Non-energy exports over Jan-Feb 2018. Manitoba reported the greatest decline, 4.7%. Nova Scotia reported a 9.6% gain in Non-energy exports. Canada reported a 3.7% gain in Non-energy exports over Jan-Feb 2018.
YTD EXPORTS BY INTERNATIONAL DESTINATION

In Jan-Feb 2019 vs Jan-Feb 2018, Nova Scotia International Merchandise trade to the United States increased 9.0% to $591.4 million. The share of total merchandise trade exports going to the United States for Jan-Feb 2019 was 64%.

In Jan-Feb 2019 vs Jan-Feb 2018, Nova Scotia International Merchandise trade to the United Kingdom increased 51.5% to $14.3 million. The share of total merchandise trade exports going to the United Kingdom for Jan-Feb 2019 was 1.6%.
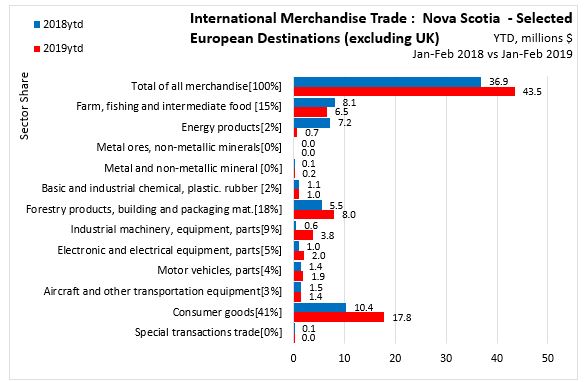
In Jan-Feb 2019 vs Jan-Feb 2018, Nova Scotia International Merchandise trade to other Europe destinations increased 5.1% to $43.5 million. The share of total merchandise trade exports going to other Europe destinations during Jan-Feb 2019 was 4.9%.
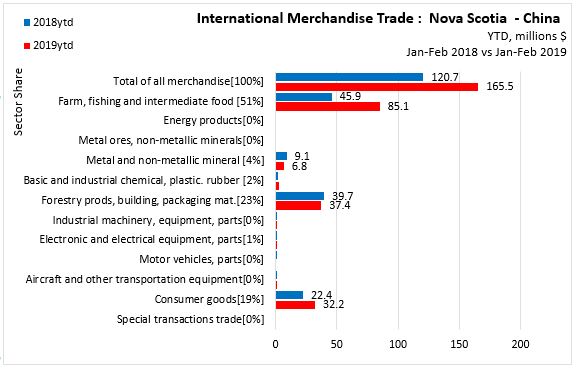
In Jan-Feb 2019 vs Jan-Feb 2018, Nova Scotia International Merchandise trade to China increased 37.1% to $165.5 million. The share of total merchandise trade exports going to China during Jan-Feb 2019 was 18%.
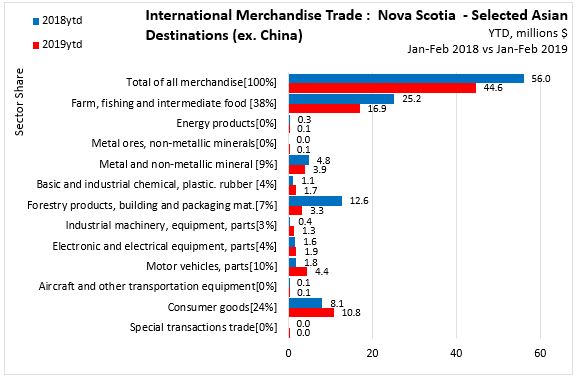
In Jan-Feb 2019 vs Jan-Feb 2018, Nova Scotia International Merchandise trade to Other Asian countries decreased 20.3% to $44.6 million. The share of total merchandise trade exports going to the Asia (excluding China) during Jan-Feb 2019 was 6%.
Note: Europe destinations include Germany, Italy, France, Netherlands, Belgium, Spain. Selected Asia destinations include Japan, South Korea, Hong Kong, India, Taiwan, Indonesia, Singapore
Statistics Canada.
12-10-0119-01 International merchandise trade by province and commodity
12-10-0119-01 International merchandise trade by province and energy commodity
12-10-0119-01 International merchandise trade Nova Scotia sectors
12-10-0119-01 International merchandise trade by province, commodity, and Principal Trading Partners (x 1,000)12-10-0099-01
All Tables: Monthly, quarterly, annually
<--- Return to Archive