The Economics and Statistics Division maintains archives of previous publications for accountability purposes, but makes no updates to keep these documents current with the latest data revisions from Statistics Canada. As a result, information in older documents may not be accurate. Please exercise caution when referring to older documents. For the latest information and historical data, please contact the individual listed to the right.
<--- Return to Archive
For additional information relating to this article, please contact:
March 22, 2019RETAIL TRADE, JANUARY 2019 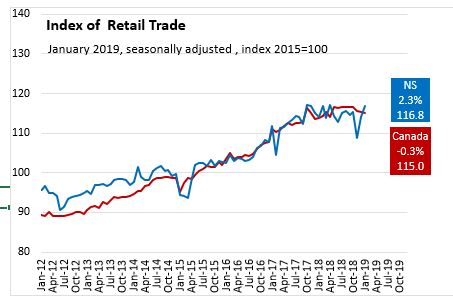
In Nova Scotia January 2019, seasonally adjusted Retail Trade increased 2.3 per cent over December 2018 to $1.4 billion and in Jan 2019 vs Jan 2018, seasonally adjusted Retail Trade increased 2.4 per cent.
Nationally, January 2019, seasonally adjusted Retail Trade decreased 0.3 per cent over December 2018 to $50.1 billion and in Jan 2019 vs Jan 2018, seasonally adjusted Retail Trade increased 1.1 per cent.
Canada and the Provinces
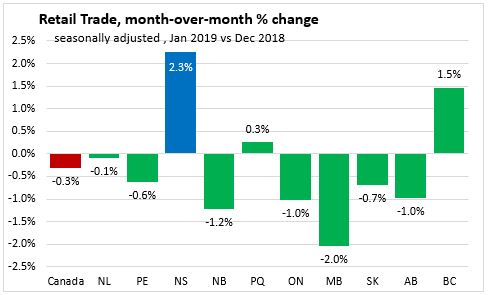
On a month over month basis, seasonally adjusted Retail Trade decreased 0.3 per cent nationally. Three provinces reported monthly increases in retail trade, with Nova Scotia (2.3 per cent) reporting the largest gain. Manitoba reported the largest decline (2.0 per cent).
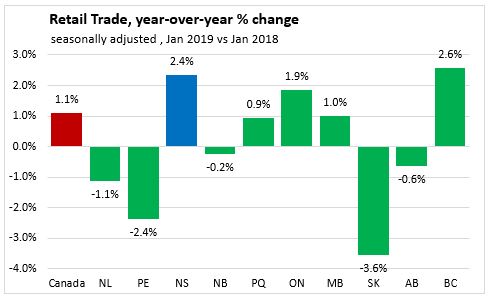
On a year over year basis, seasonally adjusted Retail Trade increased 1.1 per cent nationally. Five provinces reported year-over-year increases in retail trade, with British Columbia (2.6 per cent) reporting the largest gain. Nova Scotia reported an increase (2.4 per cent) over the same month last year. Saskatchewan reported the largest decline (3.6 per cent).
Note: No year-to-date graphic or analysis this month as Year-over-year is the same as Year-to-date.
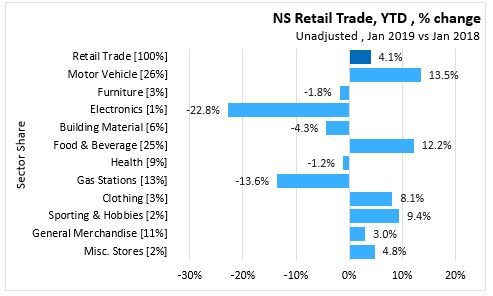
Nova Scotia Sectors
In Jan 2019, unadjusted Retail Trade increased 4.1 per cent ($44.1 million) to $1,133.6 million, over Jan 2018.
- Motor Vehicle with a 26% share of Retail Trade increased 13.5 per cent ($35.4 million).
- Furniture with a 3% share decreased 1.8 per cent ($0.5 million).
- Electronics with a 1% share decreased 22.8 per cent ($3.3 million).
- Building Material with a 6% share decreased 4.3 per cent ($3.2 million).
- Food & Beverage with a 25% share increased 12.2 per cent ($30.7 million).
- Health with a 9% share decreased 1.2 per cent ($1.2 million).
- Gas Stations with a 13% share decreased 13.6 per cent (-$22.4 million).
- Clothing with a 3% share increased 8.1 per cent ($2.4 million).
- Sporting & Hobbies with a 2% share increased 9.4 per cent ($1.6 million).
- General Merchandise with a 11% share increased 3.0 per cent ($3.5 million).
- Misc. Stores with a 2% share increased 4.8 per cent ($1.1 million).

Cannabis stores
Cannabis stores are now included under the Misc. Stores category.
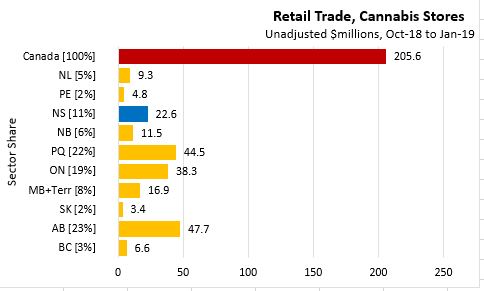
In Nova Scotia, Oct-18 to Jan-19, on a period-to-date basis, unadjusted retail cannabis store sales reached $22.6 million. This represents a 11.0% share of the Canadian market.
In Canada, Oct-18 to Jan-19, on a period-to-date basis, unadjusted retail cannabis store sales reached $205.6 million.
E-Commerce
In Canada January 2019, on a month-over-month basis, unadjusted retail e-commerce sales decreased 26.3 per cent over December 2018 to $1.5 billion, representing a 3.4% share of total retail trade.
On a year-over-year basis, unadjusted retail e-commerce sales increased 12.0 per cent over January 2018.
Note: No year-to-date analysis this month as Year-over-year is the same as Year-to-date.
Source: Statistics Canada Tables 20-10-0008-01 and 20-10-0072-01
<--- Return to Archive