The Economics and Statistics Division maintains archives of previous publications for accountability purposes, but makes no updates to keep these documents current with the latest data revisions from Statistics Canada. As a result, information in older documents may not be accurate. Please exercise caution when referring to older documents. For the latest information and historical data, please contact the individual listed to the right.
<--- Return to Archive
For additional information relating to this article, please contact:
February 26, 2019US S&P CORELOGIC CASE-SHILLER HOME PRICE INDICES, DECEMBER 2018 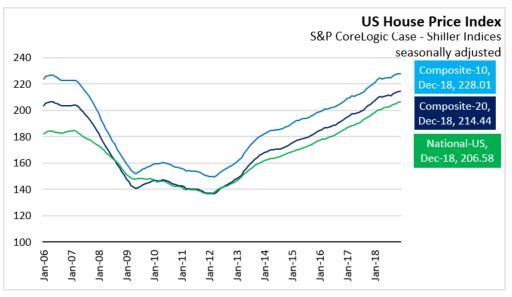
S&P Dow Jones Indices reports that US national house prices, as measured by the S&P CoreLogic Case - Shiller Indices rose by 0.3 per cent nationally in December (seasonally adjusted) from the previous month. Prices increased 0.2 per cent for both the 20-City Composite Index and for the 10-City Composite Index. All cities saw monthly price increases except for San Francisco, San Diego, and Seattle where prices declined month-to-month. Tampa, Chicago and Cleveland were about level with prices a month ago.
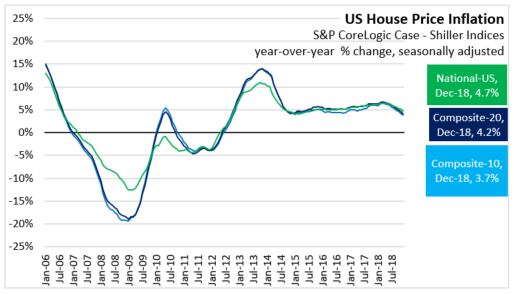
Compared with December 2017, national US house prices grew by 4.7 per cent (seasonally adjusted), continuing the trend of rising prices. Growth was steady in both the 20-City Index (4.2 per cent) and the 10-City Index (3.7 per cent).
Before seasonal adjustment, the National Index dipped slightly to 205.35 in December 2018.
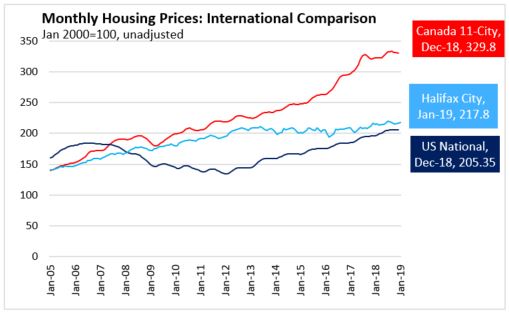
Starting from the same base period (setting the index=100 for January 2000), Canadian house prices did not experience the same rise and fall as US house prices did during the 2008-2009 financial crisis and recession. Comparable Canadian city averages and the Halifax average grew at a more stable pace through 2007-2012. Since 2012, Halifax house prices have remained largely stable while Canadian and US prices continued to grow. The Canadian house price index grew much more rapidly through 2016 and 2017, mostly because of accelerating prices in the Toronto and Vancouver markets. Growth in the Canadian house price index has slowed somewhat since August 2017.
Among the major metropolitan areas monitored by the S&P CoreLogic Case - Shiller Indices, the strongest year over year (December 2018 vs December 2017) continues to be in Las Vegas and Phoenix, while growth is slower in San Diego, Washington DC, and Chicago.

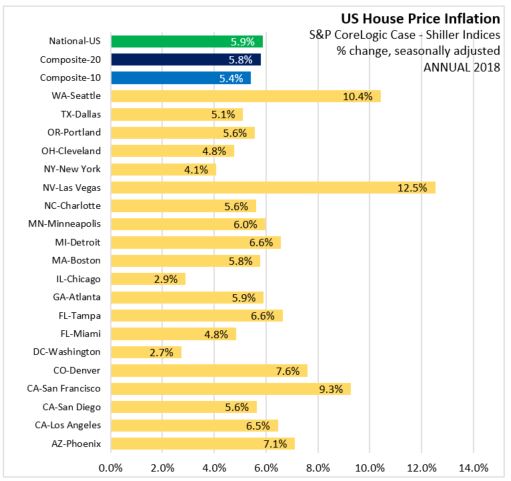
ANNUAL
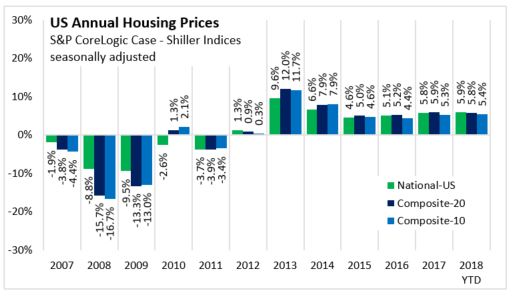
In annual terms, house price inflation in 2018 was fastest in Las Vegas, Seattle, and San Francisco, and slower in Washington DC and Chicago.  The 20 city composite saw growth of 5.8 per cent annually, and the 10 city composite saw price growth of 5.4 per cent. The national index rose 5.9 per cent over 2017 levels.
Note: The 20-City Composite Index includes Atlanta, Boston, Charlotte, Chicago, Cleveland, Dallas, Denver, Detroit, Las Vegas, Los Angeles, Miami, Minneapolis, New York, Phoenix, Portland, San Diego, San Francisco, Seattle, Tampa, and Washington DC. The 10-City Composite Index includes Boston, Chicago, Denver, Las Vegas, Los Angeles, Miami, New York, San Diego, San Francisco, and Washington DC.
Source: S&P Dow Jones Indices
<--- Return to Archive