The Economics and Statistics Division maintains archives of previous publications for accountability purposes, but makes no updates to keep these documents current with the latest data revisions from Statistics Canada. As a result, information in older documents may not be accurate. Please exercise caution when referring to older documents. For the latest information and historical data, please contact the individual listed to the right.
<--- Return to Archive
For additional information relating to this article, please contact:
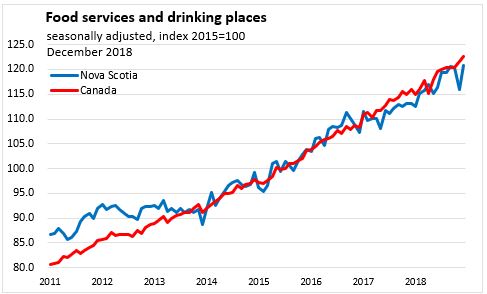
February 19, 2019FOOD SERVICES AND DRINKING PLACES, DECEMBER AND ANNUAL 2018 Although Nova Scotia’s food service and drinking place receipts exhibit somewhat more volatile growth from one month to the next, the provincial trend has been in line with national growth since 2015.
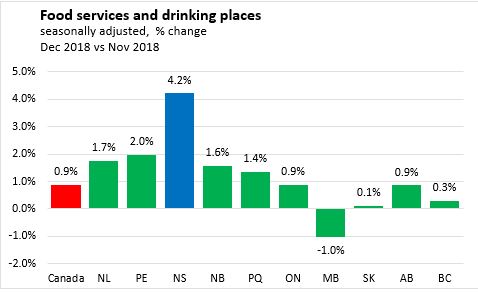
In December 2018, Statistics Canada on a month-over-month basis, reported that food services and drinking places receipts (seasonally adjusted) in Nova Scotia increased 4.2 per cent to $145.2 million over November 2018. Food services and drinking places receipts (seasonally adjusted) in Canada increased 0.9 per cent to $6.2 billion over November 2018. Nine provinces reported monthly increases in Food services and drinking places, with Nova Scotia (4.2 %) reporting the largest gain and Manitoba (-1.0 %) reporting the largest decline in percentage terms.
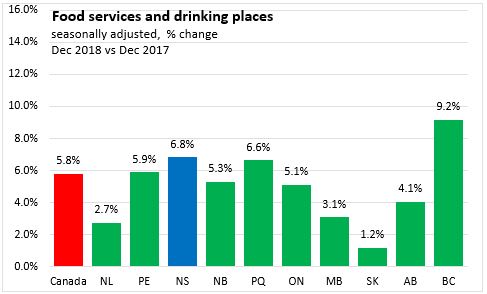
In December 2018, on a year-over-year basis, food services and drinking places receipts (seasonally adjusted) in Nova Scotia increased 6.8 per cent over December 2017. Food services and drinking places receipts (seasonally adjusted) in Canada increased 5.8 per cent over December 2017. All provinces reported year-over-year increases in Food services and drinking places, with British Columbia (9.2 %) reporting the largest gain and Saskatchewan (1.2 %) reporting the smallest gain in percentage terms.
ANNUAL
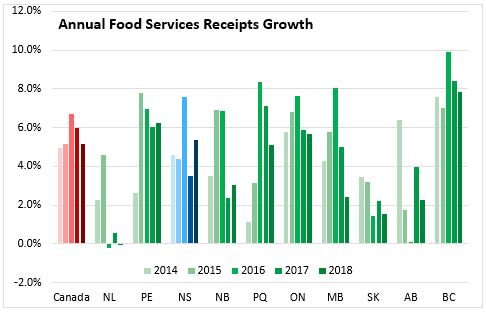
In 2018, Nova Scotia unadjusted food services and drinking places increased 5.5 per cent ($88.3 million) over 2017 to $1.7 billion. Food services and drinking places receipts (seasonally adjusted) in Canada increased 5.2 per cent ($3,856 million) over 2017 to $72.1 billion. Nine provinces reported year-to-date increases in Food services and drinking places, with British Columbia (7.9 %) reporting the largest gain and Newfoundland and Labrador (-0.0001 % or -$76,000) reporting the only decline in percentage and dollar terms.
Annual Food Services Receipt Growth
Nova Scotia Annual Sales by Establishment Type
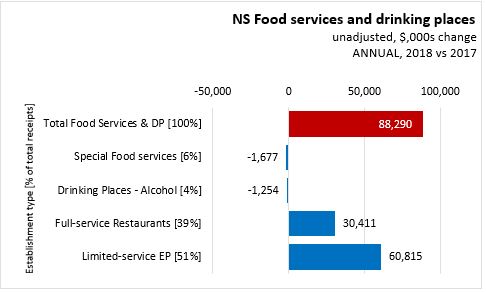
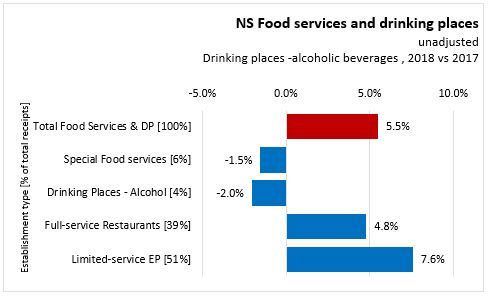
Among types of establishments,
- Limited-service eating places, accounting for 51% of total food services and drinking places receipts, increased 7.6 per cent ($60.8 million) over Jan-Dec 2017 to $863 million.
- Full-service restaurants (39% of total Food services and drinking places) increased 4.8 per cent ($30.4 million) to $664 million.
- Special food services (6% of total Food services and drinking places) decreased 1.5 per cent ($1.7 million) to $107 million.
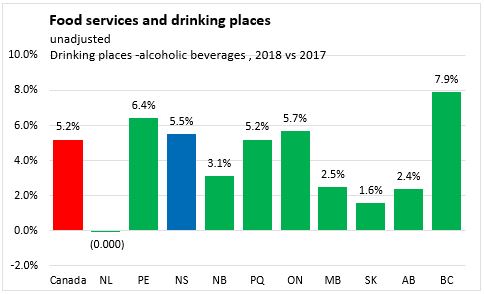
- Drinking places -alcoholic beverages (4% of total Food services and drinking places) decreased 2.0 per cent ($1.3 million) to $60 million.
BACKGROUND: FOOD SERVICES AND DRINKING PLACES
Each month, Statistics Canada reports on receipts of food services and drinking places for Canada and the Provinces. Food service and drinking place receipts are seasonally adjusted. More detailed data on receipts by type of establishment are available monthly, but these are not seasonally adjusted so only year-over-year or year-to-date analysis is appropriate.
Food service and drinking place establishments include:
- full-service restaurants, where patrons order and are served while seated and pay after eating
- limited-service eating places, where patrons order/select items at a counter and pay before eating either on premises or as take-out
- special food services, such as institutional food contractors, caterers or mobile food providers
- drinking places, primarily engaged in serving alcoholic beverages for immediate consumption (though they sometimes provide limited food services as well)
Source: Statistics Canada. Table 21-10-0019-01 Monthly survey of food services and drinking places (x 1,000)
<--- Return to Archive