The Economics and Statistics Division maintains archives of previous publications for accountability purposes, but makes no updates to keep these documents current with the latest data revisions from Statistics Canada. As a result, information in older documents may not be accurate. Please exercise caution when referring to older documents. For the latest information and historical data, please contact the individual listed to the right.
<--- Return to Archive
For additional information relating to this article, please contact:
February 11, 2019UK TRADE BALANCE DECEMBER 2018 UK import and export trade are a main contributor to the overall economic growth of the UK.
Month-over-month
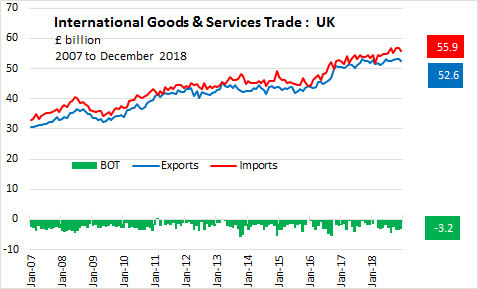
In December 2018,
- the UK seasonally adjusted goods & services trade deficit narrowed by £0.4 billion to £3.2 billion.
- Exports of goods and services decreased 1.0% (£0.5 billion) to £52.6 billion while,
- Imports of goods and services decreased 1.6% (£0.9 billion) to £55.9 billion.
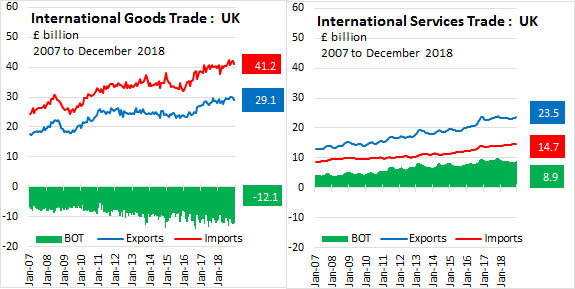
In December 2018,
- Exports of goods decreased 2.3% (£0.688 billion) to £29.1 billion while
- Imports of goods decreased 2.3% (£0.986 billion) to £41.2 billion.
- The resulting goods deficit narrowed by 2.4% (£0.298 billion) to £12.1 billion.
In December 2018,
- Exports of services increased 0.7% (£0.155 billion) to £23.5 billion while
- Imports of services increased 0.5% (£0.067 billion) to £14.7 billion.
- The resulting services surplus widened by 1.0% (£0.088 billion) to £8.9 billion.
Year-to-date Goods Export Trade by Sector
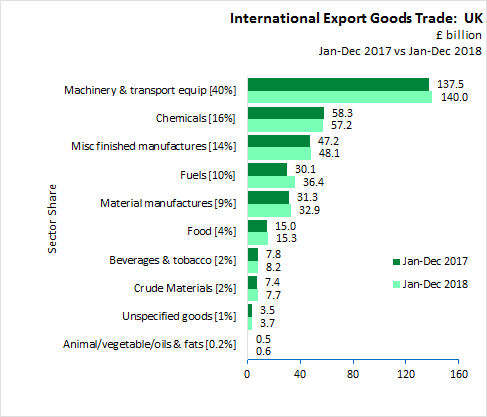
In Jan-Dec 2018,
- Machinery & transport equip sector, accounting for 40% of goods exports, increased 1.8% (£2.5 billion) to £140.0 billion.
- Chemicals sector, accounting for 16% of goods exports, decreased 2.0% (£1.2 billion) to £57.2 billion.
- Misc. finished manufactures sector, accounting for 14% of goods exports, increased 1.9% (£0.9 billion) to £48.1 billion.
- Fuels sector, accounting for 10% of goods exports, increased 21.0% (£6.3 billion) to £36.4 billion.
- Material manufactures sector, accounting for 9% of goods exports, increased 5.1% (£1.6 billion) to £32.9 billion.
- Food sector, accounting for 4% of goods exports, increased 1.8% (£0.3 billion) to £15.3 billion.
- Beverages & tobacco sector, accounting for 2% of goods exports, increased 4.9% (£0.4 billion) to £8.2 billion.
- Crude Materials sector, accounting for 2% of goods exports, increased 3.4% (£0.3 billion) to £7.7 billion.
- Unspecified goods sector, accounting for 1% of goods exports, increased 3.7% (£0.1 billion) to £3.7 billion.
- Animal/vegetable/oils & fats sector, accounting for 0.2% of goods exports, increased 6.8% (£0.036 billion) to £0.6 billion.
Trade with EU(28) and nonEU(28) countries
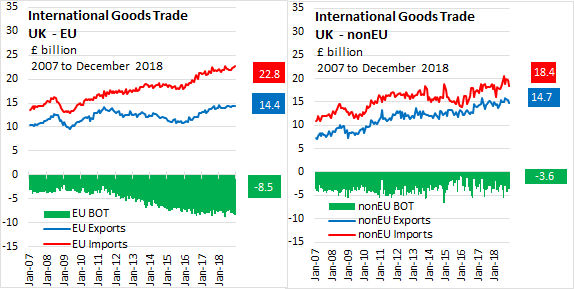
In December 2018,
- goods exports with non-European Union countries decreased 4.8% (£0.739 billion) to £14.7 billion, while
- goods imports from non-EU28 countries decreased 6.5% (£1.281 billion) to £18.4 billion.
- The resulting goods deficit narrowed by 13.0% (£0.542 billion) to £3.6 billion.
In December 2018,
- goods exports to the European Union (EU28) increased 0.4% (£0.051 billion) to £14.4 billion, while
- goods imports from the European Union increased 1.3% (£0.295 billion) to £22.8 billion.
- The resulting goods deficit widened by 3.0% (£0.244 billion) to £8.5 billion.
Source: UK Office for National Statistics, Statistical Bulletin | Time Series | Time Series Explorer
<--- Return to Archive