The Economics and Statistics Division maintains archives of previous publications for accountability purposes, but makes no updates to keep these documents current with the latest data revisions from Statistics Canada. As a result, information in older documents may not be accurate. Please exercise caution when referring to older documents. For the latest information and historical data, please contact the individual listed to the right.
<--- Return to Archive
For additional information relating to this article, please contact:
January 09, 2019VALUE ADDED IN EXPORTS, 2014 NOTE: This previous version of this article used Canadian exports for value-added and jobs for some material. This issues was was correct April 5, 2019 with value-added and jobs figures that apply only to each individual provinces' exports.
Statistics Canada has updated its estimates of value added and employment embodied in Canadian exports.
Value-added represents the contribution of labour and capital to the production process. Its components are labour income, gross operating surplus (or profits and depreciation) and taxes net of subsidies on production. The sum of value-added by all industries plus taxes net of subsidies on products is equal to GDP.
Exports only generate income (GDP) within Nova Scotia when value is added to either the domestically-produced or imported outputs. However, exports are typically reported on a gross basis, including the cost of imported inputs. Statistics Canada’s supply and use tables allow for the calculation of the proportion of exports that represent value added, and therefore, income generated within the provincial economy.
Statistics Canada's estimates calculate a value added amount within each sector that generates the exports. Statistics Canada further estimates the amount of value added created by upstream sectors within a province that supply an exporting sector. Statistics Canada also estimates the number of jobs associated with exports - both within exporting sectors and upstream sectors that supply them.
These estimates allow examination of the relative significance of trade for each province and sector. As the data are constructed using supply and use tables, there is a considerable lag in their production and they have only been updated to 2014.
Overall, Nova Scotia's economy generates the least amount of exports (scaled to total employment in all sectors) at $12,800 per worker. Oil-producing provinces have the largest export values, each in excess of $50,000 in exports per worker.

Of the total value added in the economy, Nova Scotia relies the least on exports to generate value added (9.5 per cent). Oil-producing provinces each generated substantially more provincial value added from exports.

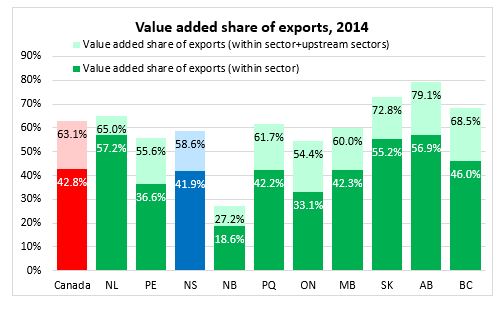
Despite its relatively low export intensity, the amount of value added generated per dollar of exports in Nova Scotia (41.9 per cent) is comparable to the national average (42.8 per cent). Counting the value added in exports created upstream of the exporting sector, 58.6 per cent of Nova Scotia's exports represent value added that generates income within the province. New Brunswick's value added share of exports is notably low because of the large value of imported content in its petroleum refining sector.
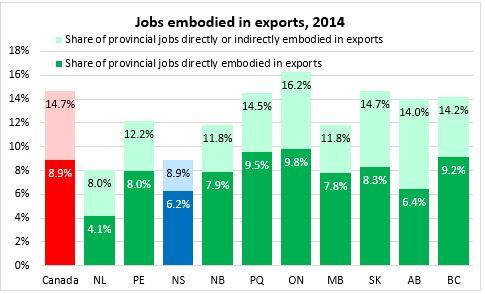
Nova Scotia's employment is less connected to international exports as only 6.2 per cent of jobs are attributable to direct exports. Including upstream jobs embodied in exports, Nova Scotia's share of employment connected to exports is 8.9 per cent. The national average share of employment from exports is 14.7 per cent. The highest share is in Ontario at 16.2 per cent while the lowest is in Newfoundland and Labrador at 8.0 per cent.
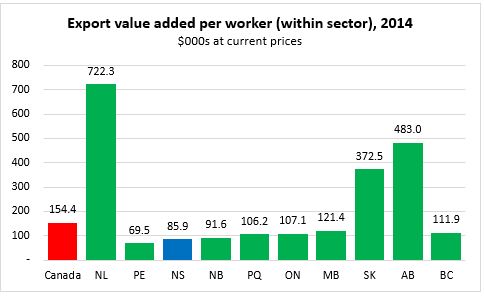
The amount of export value added per worker (directly within exporting sectors) is $85,900 for Nova Scotia, well below the national average of $154,400. The national average of value added per worker (within sector) is inflated by oil-producing provinces where export values are high relative to low employment within the oil and gas sector. (This data is also from 2014 when oil prices were much higher).
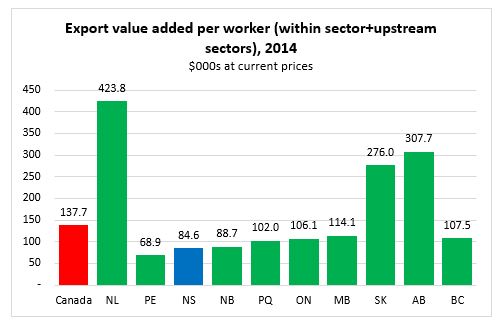
Including upstream value added to exports and upstream employment, Nova Scotia's export value added per worker is slightly lower. However, export value added per worker in oil provinces is considerably lower after including upstream workers.
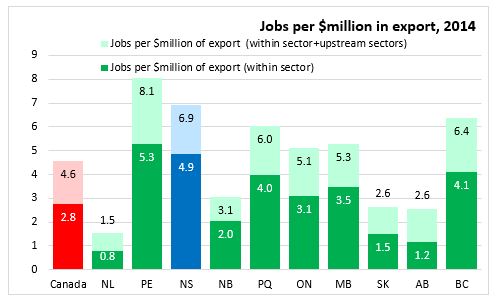
Calculating the number of workers required to generate $1 million in export value added offers another perspective on the relationship between exports and employment. Nova Scotia's exports are the second most labour intensive in the country after those from Prince Edward Island, requiring 6.9 jobs to generate $1 million in export value added.
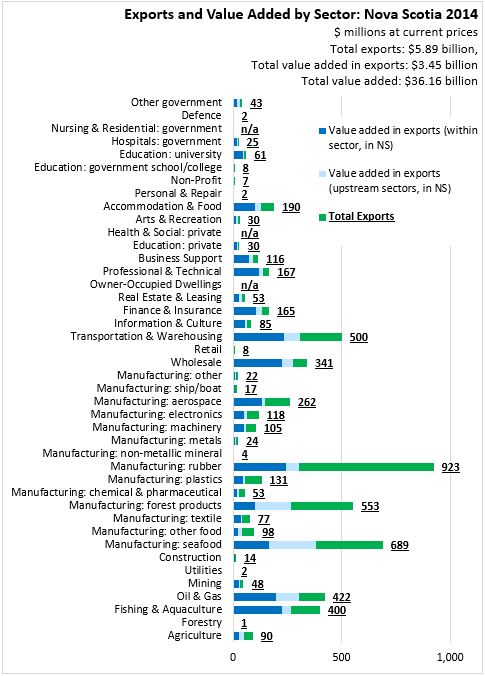
The value added in exports data also provides the most detailed information on the value of exports from all sectors, including services. Of the total value of $5.89 billion in exports from Nova Scotia in 2014, the largest values were from manufacturing, notably rubber products ($923 million), seafood products ($689 million, not including unprocessed) and forest products ($553 million). Transportation services ($500 million), oil/gas ($422 million) and unprocessed fish ($400 million, including aquaculture) contributed the next largest exports.
From these exports, Nova Scotia generated $3.45 billion in added value, including the exporting sector as well as upstream sectors within the province. The chart below illustrates the amount of value added generated within each exporting sector as well as the value added generated in upstream sectors.
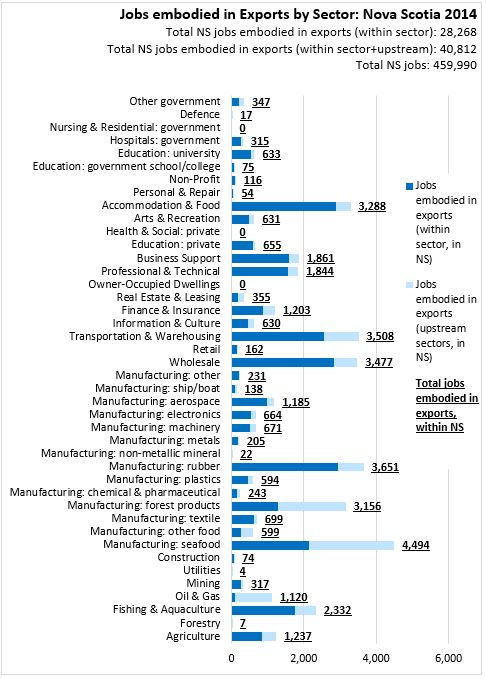
Statistics Canada estimates that in 2014 28,268 jobs were directly attributable to exports from a sector. Including upstream sectors, 40,812 jobs in Nova Scotia depended on exports. Seafood processing exports generated almost 4,500 jobs in 2014 - divided evenly between jobs in the sector itself and upstream sectors. The next largest contributions of exports to employment were reported in rubber products, transportation/warehousing, wholesale trade, accommodation/food and forest products.
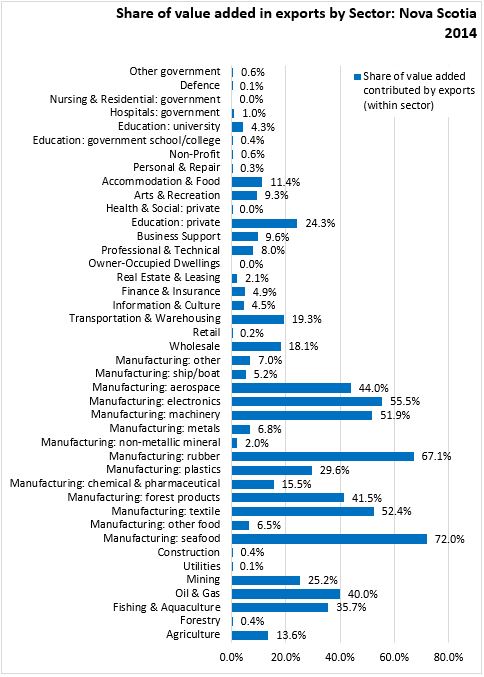
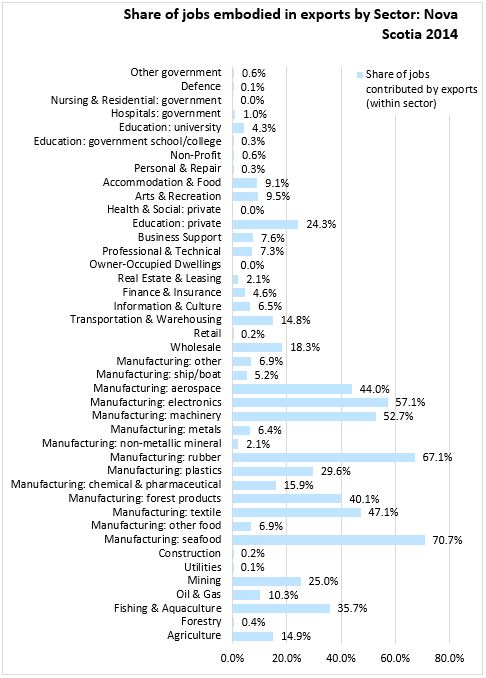
Measured in percentage terms (by either value added or employment), Nova Scotia's most export-intensive sectors in 2014 were all in manufacturing: seafood processing, rubber products, electronics, textiles, machinery, aerospace and forest products. Mining and fishing/aquaculture also reported higher export shares of value added and employment. Oil/gas also reported higher export share of value added, but not of employment.
Statistics Canada: Table 12-10-0100-01 Value added in exports, by industry, provincial and territorial
<--- Return to Archive