The Economics and Statistics Division maintains archives of previous publications for accountability purposes, but makes no updates to keep these documents current with the latest data revisions from Statistics Canada. As a result, information in older documents may not be accurate. Please exercise caution when referring to older documents. For the latest information and historical data, please contact the individual listed to the right.
<--- Return to Archive
For additional information relating to this article, please contact:
December 31, 2018NOVA SCOTIA INTERNATIONAL TRADE 2017 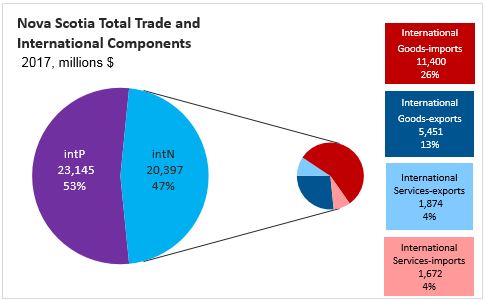
The trade data in the economic accounts represent provincial total and net expenditures in interprovincial (intP) and international (intN) markets. As there are important differences in the characteristics of intN and intP markets, it is useful to provide a separate analysis. In this note, the focus is on international (intN) trade.
Several components of international trade are considered separately and in combination. These include exports, imports, goods, services, total and net trade. Net trade (exports less imports). Total international trade is the sum of international imports and exports (E&I) for goods and services.
Total international trade is comprised of four components.
In 2017, in order by value, they are:
- international goods-imports ($11.400 billion);
- international goods-exports ($5.451 billion);
- international services-imports ($1.672 billion); and
- international services-exports ($1.874 billion);
- Summed, they total $20.397 billion.
By commodity category:
- international total goods trade valued at $16.9 billion (82.6% share) make up the larger share
- international total services trade was valued at $3.5 billion (17.4% share).
By market category:
- international total imports valued at $13.072 billion (64.1% share) make up the larger share
- international total exports were valued at $7.325 billion (35.9% share).
The result is, Nova Scotia’s international net trade is a $5.747 billion excess of imports over exports.
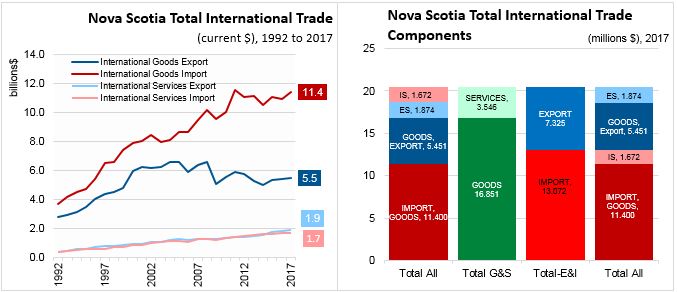
INTERNATIONAL TRADE GROWTH
All values and growth rates are calculated at current market prices. Changes in prices (notably for internationally traded commodities like food and energy) will influence growth rates and levels.
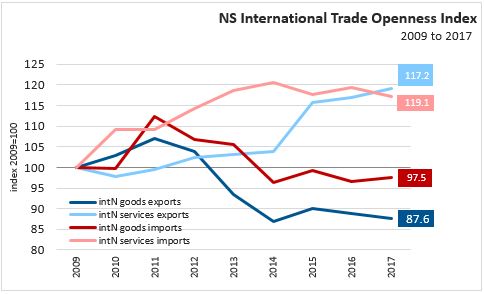
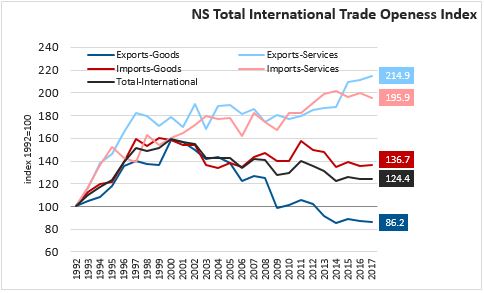
INTERNATIONAL TRADE OPENNESS 2009-2017
The trade openness index is a measure of the relative increase in trade growth to GDP growth. The total international trade openness index provides evidence to the expansion or contraction of the various international trade sectors.
The international trade overview presented above provides insight Nova Scotia trade performance since the recession of 2009. The following overview provides a longer-range view to highlight trade over the last 35 years. This period (1992-2017) saw rapid global trade expansion, as China entered the international market, Nova Scotia exported a new, major commodity (natural gas). There was a global financial crisis, and an economic recession and economic recovery while natural gas production diminished steadily.
Statistics Canada Tables 36-10-0222-01
<--- Return to Archive