The Economics and Statistics Division maintains archives of previous publications for accountability purposes, but makes no updates to keep these documents current with the latest data revisions from Statistics Canada. As a result, information in older documents may not be accurate. Please exercise caution when referring to older documents. For the latest information and historical data, please contact the individual listed to the right.
<--- Return to Archive
For additional information relating to this article, please contact:
November 28, 2018CANADIAN SURVEY ON DISABILITY, 2017 Statistics Canada has released results from the 2017 Canadian Survey on Disability. This survey provides insights on the prevalence, severity and type of disability reported by Canadians across the country.
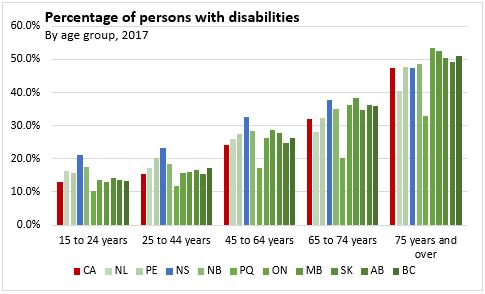
The age-standardized (to the overall Canadian population) prevalence of disabilities among all Canadians aged 15 years and over was 24.3 per cent. Nova Scotia's age-standardized prevalence of disabilities was 24.8 per cent. The highest prevalence of disabilities was in Alberta and the lowest was in Ontario.

Nova Scotia reported the highest prevalence of disability for each of the age cohorts age 15 to 24, 25 to 44, and 45 to 64 years and second highest for the age cohort 64 to 74 (Manitoba had the highest prevalence for this age group). The highest prevalence of disability among those aged 75 and over was in Ontario, followed by Manitoba. Quebec reported the lowest prevalence of disability in every age cohort.
SEVERITY OF DISABILITY
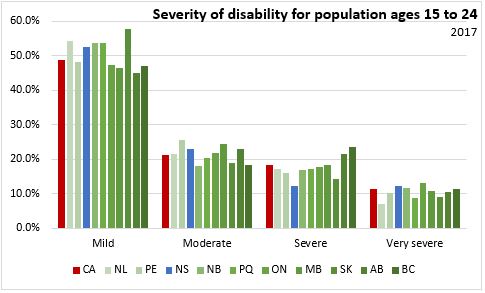
Mild and moderate disabilities account for the majority of disabilities reported among those aged 15-24 and 25-44. However, in older age cohorts the incidence of severe and very severe disabilities is more common.
Among the provinces, Nova Scotia reports the lowest incidence of severe disabilities for the population with disabilities aged 15 to 24 and 25 to 44. The prevalence of mild, moderate and very severe disabilities are above the Canadian average among these age groups.

For the age group 45 to 64, Nova Scotians with disabilities are more likely to report moderate to very severe disabilities compared to the Canadian average.

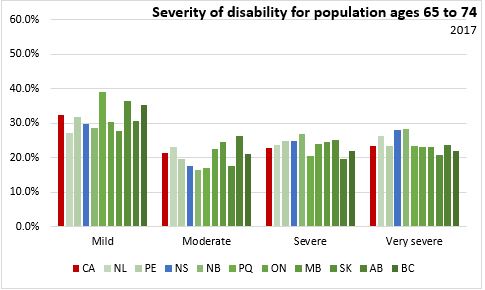
Among those aged 65 to 74 with a disability, people are more likely to report severe or very severe disabilities in Nova Scotia compared to the Canadian average.
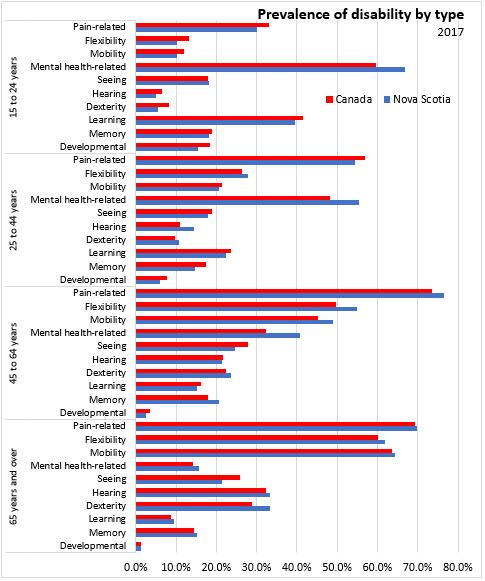
TYPE OF DISABILITIES
The most common disabilities among older age cohorts are related to pain, mobility, flexibility, dexterity and hearing. Mental-health related disabilities are most prevalent among younger age cohorts, as well as pain and learning disabilities.
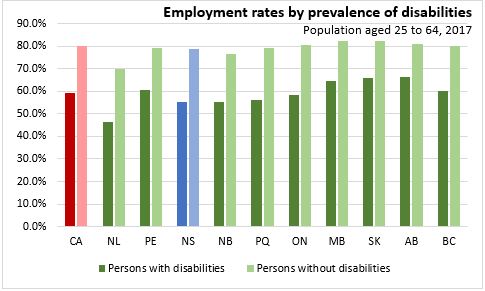
LABOUR FORCE STATUS
Participation in the labour force is less prevalent among those aged 25 to 64 with disabilities. Nationally, the participation rate for persons with disabilities was 64.7 per cent compared to 84.8 per cent for persons without disabilities. The gap between participation rates across the country is relatively consistent at around 20 percentage points, and is lowest in the prairie provinces.

Employment rates for persons with disabilities are lower than unemployment rates for the population without disabilities. In the 25 to 64 age cohort, the national employment rate for persons with disabilities was 59.3 per cent compared to 80.1 per cent for those without disabilities. The gap between employment rates is largest in Newfoundland and Labrador and Prince Edward Island and lowest in Saskatchewan and Alberta.
Canadian Survey on Disability, 2017
<--- Return to Archive