The Economics and Statistics Division maintains archives of previous publications for accountability purposes, but makes no updates to keep these documents current with the latest data revisions from Statistics Canada. As a result, information in older documents may not be accurate. Please exercise caution when referring to older documents. For the latest information and historical data, please contact the individual listed to the right.
<--- Return to Archive
For additional information relating to this article, please contact:
November 07, 2018EU AND EURO AREA RETAIL TRADE, SEPTEMBER 2018 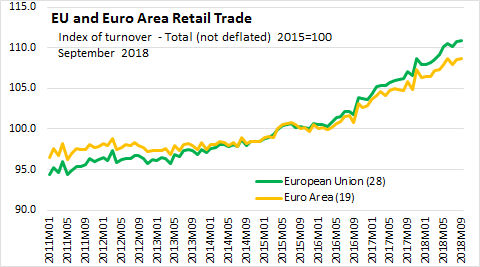
In the European Union, on a month-over-month basis, Retail sales (seasonally adjusted index of turnover value) were up 0.1 per cent in September 2018 over August 2018. In the Euro Area, Retail sales were up 0.1 per cent in September 2018.
In the European Union, on a year-to-date basis, Retail sales (seasonally adjusted index of turnover value) were up 3.7 per cent in Jan-Sep 2018 vs Jan-Sep 2017. In the Euro Area, Retail sales were up 3.0 per cent in Jan-Sep 2018 vs Jan-Sep 2017.
In the European Union, where Jan-Sep 2018 vs Jan-Sep 2017 data is available, the strongest growth in year-to-date retail sales occurred in Romania (12.1%), Hungary (9.7%), Lithuania (9.6%), Poland (8.3%), Latvia (7.1%), and the weakest growth occurred in Denmark (1.1%), Belgium (0.8%) and Italy (0.6%);
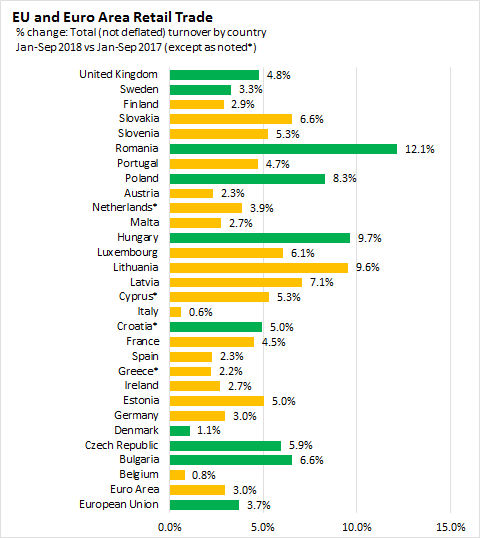
*~Jan-Jul
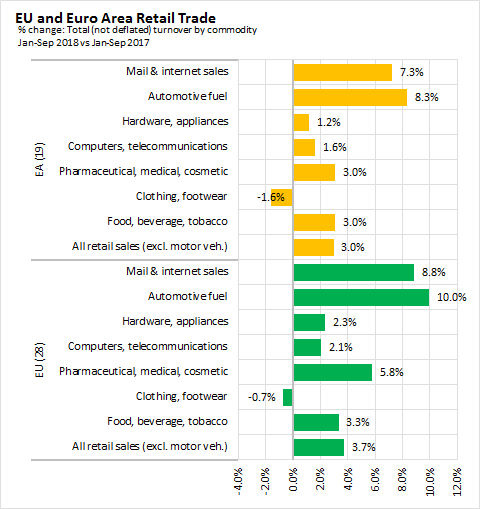
In the European Union, by retail sector, the strongest growth in Jan-Sep 2018 vs Jan-Sep 2017) is found in Automotive fuel (10.0%) followed by Mail & internet sales (8.8%), Pharmaceutical, medical, cosmetic (5.8%); Food, beverage, tobacco (3.3%); Hardware, appliances (2.3%); Computers, telecommunications (2.1%). The poorest showing was in Clothing, footwear (-0.7%).
In the Euro area, by retail sector, the strongest growth in Jan-Sep 2018 vs Jan-Sep 2017) is found in Automotive fuel (8.3%) followed by Mail & internet sales (7.3%), Food, beverage, tobacco (3.0%); Pharmaceutical, medical, cosmetic (3.0%); Computers, telecommunications (1.6%); Hardware, appliances (1.2%). The poorest showing was in Clothing, footwear (-1.6%).
Source: EuroStat News Release, Database
<--- Return to Archive