The Economics and Statistics Division maintains archives of previous publications for accountability purposes, but makes no updates to keep these documents current with the latest data revisions from Statistics Canada. As a result, information in older documents may not be accurate. Please exercise caution when referring to older documents. For the latest information and historical data, please contact the individual listed to the right.
<--- Return to Archive
For additional information relating to this article, please contact:
October 10, 2018BUILDING PERMITS, AUGUST 2018 
In August, the value of building permits issued in Nova Scotia declined 6.2 per cent, following a (revised) gain of 36.5 per cent in July. Non-residential building permits increased 9.8 per cent while residential permits declined 15.5 per cent . Monthly results for building permits are highly volatile; the six-month moving average of residential permits trended modestly upwards through 2017 and then declined in early 2018. In recent months, the downward trend in residential permits has reversed somewhat. The non-residential permits' six-month moving average has remained flat since mid-2017.
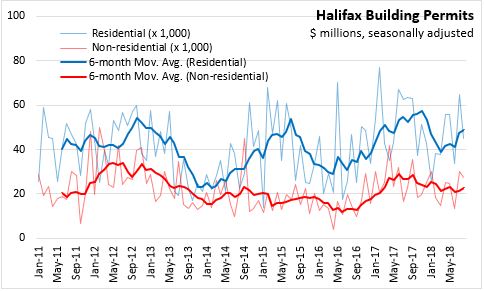
The trend in Nova Scotia building permit values largely reflects the trends in the Halifax market. In August, the value of Halifax building permits declined by 23.8 per cent, reflecting decreases in both non-residential (-9.3 per cent) and residential (-30.6 per cent) permits. The six-month moving average for residential permits in Halifax rose from mid-2016 through 2017 and then declined in the early months of 2018. Non-residential permits in Halifax have trended down since last June.
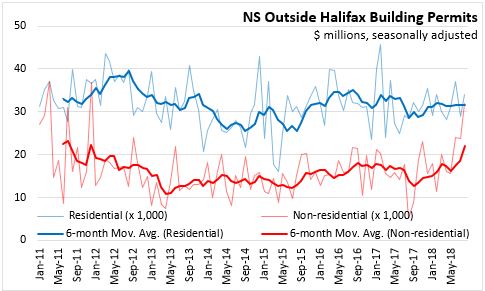
Outside the Halifax market, building permit values were up 25.5 per cent in August, reflecting a 18.4 per cent increase in residential permits and a 34.0 per cent increase in non-residential permits.
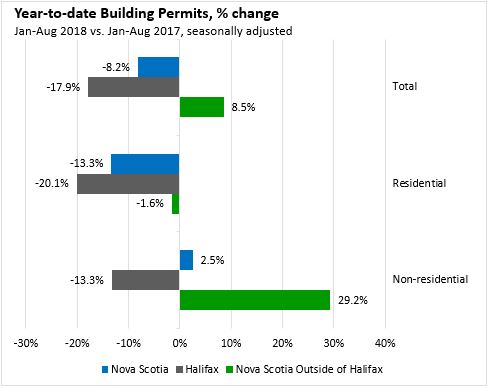
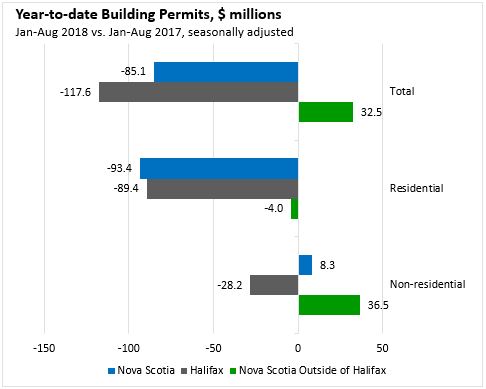
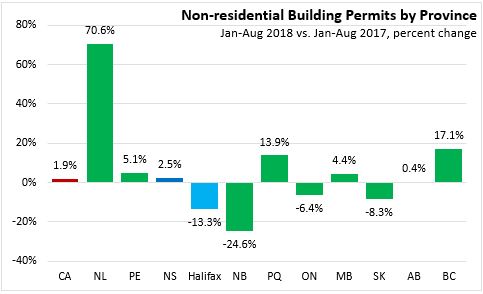
In the first eight months of 2018, the value of Nova Scotia building permits was down 8.2 per cent compared to the same period in 2017. Residential permits are 13.3 per cent lower than the first eight months of 2017, while non-residential permits are up 2.5 per cent. The increase in non-residential building permits reflects increases in commercial (+1.5 per cent) and industrial (+73.3 per cent), partially offset by a 43.0 per cent decline in institutional and governmental permits. Halifax building permits were down 17.9 per cent over January to August 2017, while building permits outside of Halifax rose by 8.5 per cent.
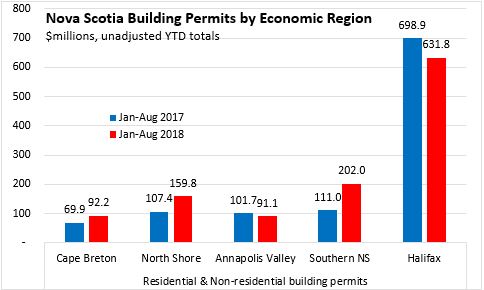
Nova Scotia's five economic regions combined for a total of $191.4 million (unadjusted) in residential and non-residential building permits in August 2018. The largest contributor was the Halifax region, at a combined residential and non-residential permit value of $92.2 million.
So far in 2018, building permits (unadjusted) among the economic regions totaled $889.7 million, of which 71.0 per cent was in Halifax economic region.
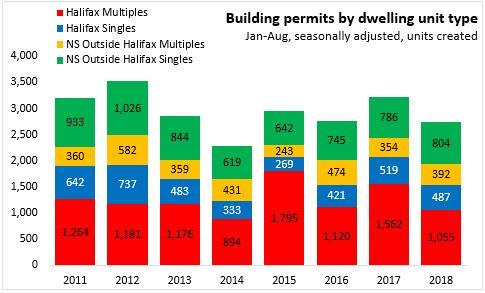
In the first eight months of 2018, the number of residential dwelling-units created in Nova Scotia was down 479 units over the same period in 2017. In Halifax, both singles and multiples created were down on a year-to-date basis. Outside of Halifax, singles and multiples were both up.
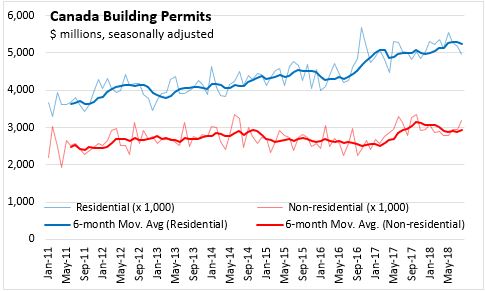
Nationally, residential building permit values were on an upward trend in 2016 but have levelled off since early 2017. Residential building permits decreased 4.4 per cent in August. Non-residential building permit values had been trending upward in 2017 after declining through 2015 and 2016 but have recently peaked. Non-residential building permits increased 8.8 per cent in August.
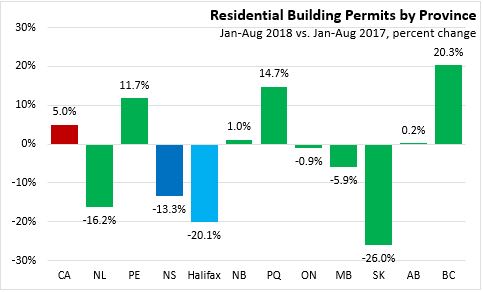
Comparing the first eight months of 2018 with the same period in 2017, British Columbia had the largest gains (+20.3 per cent) in residential permits, in percentage terms. Saskatchewan posted the largest decline (-26.0 per cent) over this period.
Year-to-date, Newfoundland and Labrador had the largest gains in non-residential building permits (+70.6 per cent) while New Brunswick reported the largest decline (-24.6 per cent).
Total building permits were up in five provinces in the first eight months of 2018, with British Columbia (+19.4 per cent) and Newfoundland and Labrador (+19.0 per cent) reporting the largest gains (in percentage terms). Saskatchewan reported the largest decline over this period (-17.7 per cent) followed by New Brunswick (+14.6 per cent).

Sources: Statistics Canada Table 34-10-0066-01
<--- Return to Archive