|
|
The Economics and Statistics Division maintains archives of previous publications for accountability purposes, but makes no updates to keep these documents current with the latest data revisions from Statistics Canada. As a result, information in older documents may not be accurate. Please exercise caution when referring to older documents. For the latest information and historical data, please contact the individual listed to the right.
<--- Return to Archive
For additional information relating to this article, please contact: October 10, 2018UK TRADE BALANCE AUGUST 2018 Month-over-month
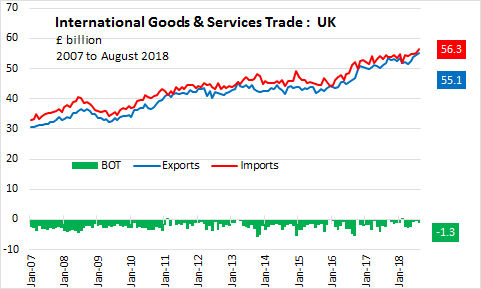
In August 2018,
- the UK seasonally adjusted goods & services trade deficit widened by £702 million to £1.3 billion.
- Exports of goods and services increased 1.1% (£626 million) to £55.1 billion while,
- Imports of goods and services increased 2.4% (£1.3 billion) to £56.3 billion.

In August 2018,
- exports of goods increased 1.4% (£429 million) to £30.6 billion while
- Imports of goods increased 3.1% (£1.2 billion) to £41.8 billion.
- The resulting goods deficit widened by 7.8% (£808 million) to £11.2 billion.
In August 2018,
- exports of services increased 0.8% (£197 million) to £24.5 billion while
- Imports of services increased 0.6% (£91 million) to £14.6 billion.
- The resulting goods surplus widened by 1.1% (£106 million) to £9.9 billion.
Year-to-date Goods Trade by Sector
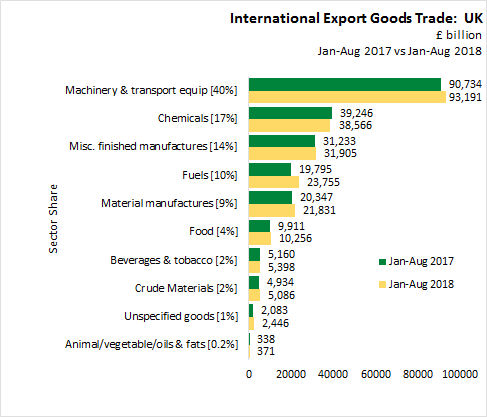
In Jan-Aug 2018,
- Machinery & transport equip sector, accounting for 40% of goods exports, increased 2.7% (£2.5 billion) to £93.2 billion.
- Chemicals sector, accounting for 17% of goods exports, decreased 1.7% (-£0.7 billion) to £38.6 billion.
- finished manufactures sector, accounting for 14% of goods exports, increased 2.2% (£0.7 billion) to £31.9 billion.
- Fuels sector, accounting for 10% of goods exports, decreased 20.0% (£4.0 billion) to £23.8 billion.
- Material manufactures sector, accounting for 9% of goods exports, increased 7.3% (£1.5 billion) to £21.8 billion.
- Food sector, accounting for 4% of goods exports, increased 3.5% (£0.3 billion) to £10.3 billion.
- Beverages & tobacco sector, accounting for 2% of goods exports, increased 4.6% (£0.2 billion) to £5.4 billion.
- Crude Materials sector, accounting for 2% of goods exports, increased 3.1% (£0.2 billion) to £5.1 billion.
- Unspecified goods sector, accounting for 1% of goods exports, increased 17.4% (£0.4 billion) to £2.4 billion.
- Animal/vegetable/oils & fats sector, accounting for 0.2% of goods exports, increased 9.8% (£33 million) to £0.4 billion.
Trade with EU(28) and nonEU(28) countries
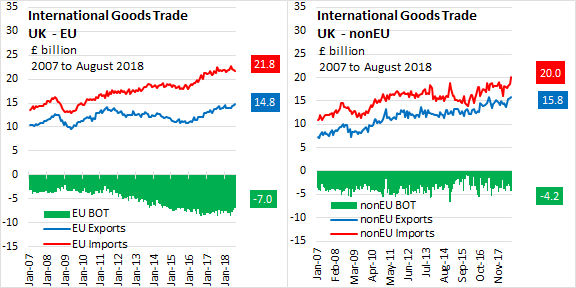
In August 2018,
- goods exports with non-European Union countries increased 1.7% (£263 million) to £15.8 billion, while
- goods imports from non-EU28 countries increased 7.2% (£1.34 billion) to £20 billion.
- The resulting goods deficit widened by 34.3% (£1.08 billion) to £4.2 billion.
In August 2018,
- goods exports to the European Union (EU28) increased 1.1% (£166 million) to £14.8 billion, while
- goods imports from the European Union decreased 0.5% (£103 million) to £21.8 billion.
- The resulting goods deficit narrowed by 3.7% (£269 million) to £7.0 billion.
Source: UK Office for National Statistics, Statistical Bulletin | Time Series | Time Series Explorer
<--- Return to Archive
|
|