The Economics and Statistics Division maintains archives of previous publications for accountability purposes, but makes no updates to keep these documents current with the latest data revisions from Statistics Canada. As a result, information in older documents may not be accurate. Please exercise caution when referring to older documents. For the latest information and historical data, please contact the individual listed to the right.
<--- Return to Archive
For additional information relating to this article, please contact:
October 04, 2018CANADA - CHINA TRADE RECONCILIATION 2016 Canada's and China's Bilateral Trade Data
In 2016, Statistics Canada reported Canadian goods and services exports to China totaled $18.2 billion, and Canadian imports from China totaled $50.5 billion. Meanwhile, the Ministry of Commerce of the People's Republic of China (MOFCOM) reported goods and services exports from Canada totaled $29.0 billion and goods and services imports to Canada totaled $44.2 billion. The differences ($21.5 eastbound and -$26.0 billion westbound) in the reports can be explained by the methods and circumstances of trade data computation.

Note: For the purpose of this study, all Canadian values were converted to US$ using the Bank of Canada's monthly average noon spot rate.
Eastbound: Canada = imports from China; China = exports to Canada
Westbound: Canada = exports to Cina; China = imports from Canada
Some computations may show small differences due to rounding. The data reflects the data published in the source article.
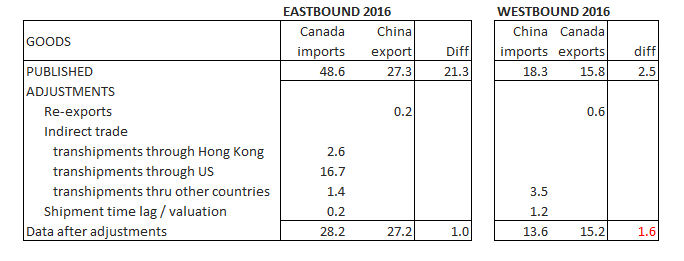
GOODS TRADE
The major differences in the goods trade computations between Canada and China (eastbound) are mainly the result of Indirect trade: trans-shipments of China exports to Canada via Hong Kong, the United States and other countries. Canadian firms receiving goods from China record $48.6 billion in goods received, but trade documents do not record the $2.6 billion shipped from China to Canada via Hong Kong, the $16.7 billion shipped fron China to Canada via the United States and the $1.4 billion shipped from China to Canada via other countries.
For westbound trade, (Canada's exports to China) trade documents do not record the country of origin (Canada) for $3.5 billion of Canadian exports received by Chinese traders indirectly via an other country (i.e. shipped from Canada to South Korea then transhipped to China).
SERVICES TRADE
International trade in services is the more difficult to measure. Payment is often via credit card to international financial institutions. Purchasers on a national carrier (ie. airline) may have different destinations. Thus China travel imports tend to be the category of services with the greatest bilateral trade differences. Travel costs sometimes includes the purchase of goods, rather than services
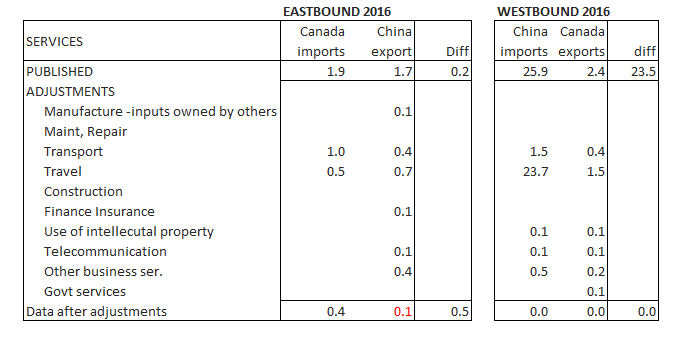
The reconcilationexplains all but $1.5 billion in the eastbound trade and all but -$1.6 billion of the westbound trade.

BILATERAL TRADE STUDIES
Statistics Canada TC Daily:
US Dept. of Commerce
Merchandise Trade Reconciliation: United States - Mexico - Canada, 1998-1999
Global Affairs Canada
NAFTA @ 10 - A preliminary Report
OTHER LINKS
Industry Canada's Strategis and STC Trade Database
Moody's Economic Indicators: Canada Exports of Goods
<--- Return to Archive