The Economics and Statistics Division maintains archives of previous publications for accountability purposes, but makes no updates to keep these documents current with the latest data revisions from Statistics Canada. As a result, information in older documents may not be accurate. Please exercise caution when referring to older documents. For the latest information and historical data, please contact the individual listed to the right.
<--- Return to Archive
For additional information relating to this article, please contact:
July 20, 2018RETAIL TRADE, MAY 2018 Month-over month
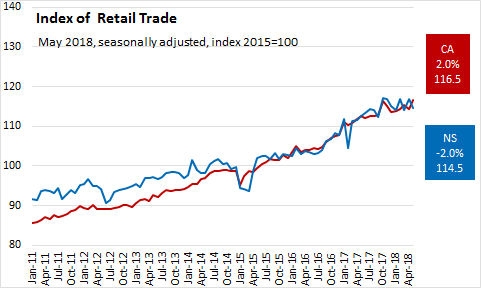
In May 2018, Nova Scotia's seasonally adjusted retail sales decreased 2.0 per cent over April 2018 to $1.34 billion. Year-over-year, retail sales are 1.6 per cent higher than in May 2017. The Nova Scotia retail trade index (2015=100) decreased to 114.5.
Nationally, seasonally adjusted retail sales increased 2.0 per cent to $50.8 billion in May. Retail sales are up 3.6 per cent, year-over-year. The Canada retail trade index (2015=100) increased to 116.5.
Canada and the Provinces
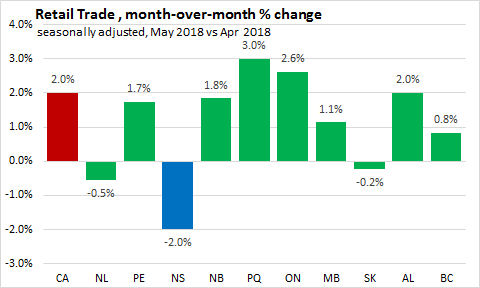
In May 2018, three provinces reported month-over-month declines in seasonally adjusted retail sales. In percentage terms, the largest gains were in Quebec (+3.0 per cent) followed closely by Ontario (+2.6 per cent).
All provinces except Newfoundland and Labrador, New Brunswick and Manitoba reported positive year-over year (May 2018 over May 2017) retail sales growth. The largest gains were in British Columbia (+5.3 per cent) and Prince Edward Island (+5.2 per cent).

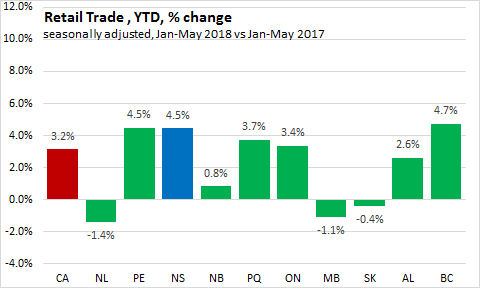
On a year-to-date basis, six provinces reported increased retail sales compared to the same period in 2017. British Columbia had the strongest growth (+4.7 per cent), in percentage terms, followed by Nova Scotia and Prince Edward Island (+4.5 per cent). Newfoundland and Labrador reported the largest declines (-1.4 per cent). Nationally, retail sales were up by 3.2 per cent in the first five months of 2018.
Nova Scotia Sectors
In Nova Scotia Jan-May 2018, Unadjusted year-to-date Retail Trade increased 4.7% (+$278.8 million) over Jan-May 2017 to $6.2 billion.
- Motor Vehicle with a 28% share of Retail Trade decreased 2.3% (-$39.5 million).
- Furniture with a 3% share increased 33.3% (+$38.7 million).
- Electronics with a 1% share increased 11.6% (+$7.8 million).
- Building Material with a 7% share increased 14.7% (+$53.7 million).
- Food & Beverage with a 21% share increased 2.6% (+$33.2 million).
- Health with a 8% share increased 2.9% (+$14.1 million).
- Gas Stations with a 14% share increased 16.1% (+$122.7 million).
- Clothing with a 3% share increased 2.8% (+$5.4 million).
- Sporting & Hobbies with a 2% share decreased 1.3% (-$1.3 million).
- General Merchandise with a 11% share decreased 0.3% (-$1.7 million).
- Misc. Stores with a 2% share increased 45.5% (+$45.6 million).


Source: Statistics Canada Tables 20-10-0008-01 and 20-10-0072-01
<--- Return to Archive