The Economics and Statistics Division maintains archives of previous publications for accountability purposes, but makes no updates to keep these documents current with the latest data revisions from Statistics Canada. As a result, information in older documents may not be accurate. Please exercise caution when referring to older documents. For the latest information and historical data, please contact the individual listed to the right.
<--- Return to Archive
For additional information relating to this article, please contact:
June 15, 2018MANUFACTURING SHIPMENTS, APRIL 2018 Nova Scotia
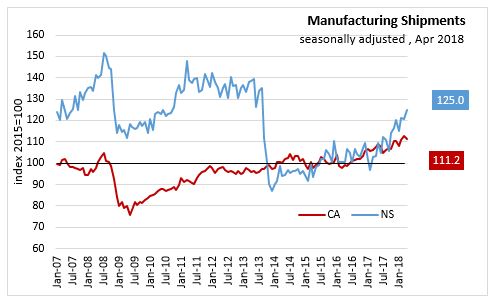
In Nova Scotia April 2018 seasonally adjusted Manufacturing Shipments increased 3.4% to $802.8 million over March 2018 and increased 20.8% over April 2017.
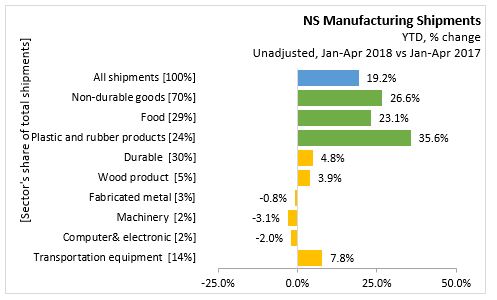
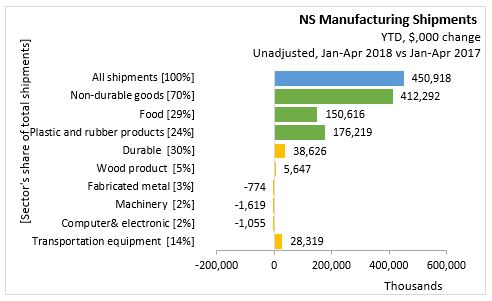
Unadjusted year-to-date (Jan-Apr 2018) manufacturing shipments have increased 19.2% ($450.9 million) over the same period last year.
- Non-durable goods shipments, accounting for 70% of manufacturing shipments, increased 26.6% ($412.3 million),
- Food with a 29% share increased 23.1% ($150.6 million)
- Plastic and rubber products with a 24% share increased 35.6% ($176.2 million)
- Durable manufacturing, accounting for 30% of Manufacturing Shipments, increased 4.8% ($38.6 million)
- Wood products with a 5% share increased 3.9% ($5.6 million)
- Fabricated metal with a 3% share decreased 0.8% (-$0.8 million)
- Machinery with a 2% share decreased 3.1% (-$1.6 million)
- Computer& electronic with a 2% share decreased 2.0% (-$1 million)
- Transportation equipment with a 14% share increased 7.8% ($28.3 million)
CANADA
Canada seasonally adjusted manufacturing sales decreased 1.3% to $56.2 billion in April 2018, and increased 3.6% over the same month last year. Compared to March 2018, overall sales decreased in 10 of 21 industries representing just under half of the manufacturing sectors. Lower shipments were due to petroleum and coal products maintenance shutdowns, weaker sales of other transportation equipment and lower production of aerospace products and parts. Sales were up in 11 industries with the largest increases in primary metal manufacturing (+3.8%) and food products (+1.9%). Durable goods decreased 1.1% and non-durable goods were down 1.4%.
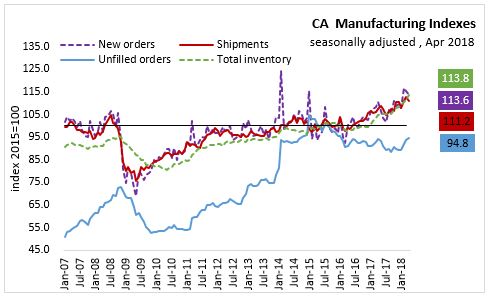
Inventory levels increased for the seventh consecutive month with 2.2% growth in April 2018 to $81.2 billion. The inventory to sales ratio increased from 1.40 to 1.44 and is at its highest value since August 2009. Unfilled orders increased for the third consecutive month with an increase of 1.3% to $90.0 billion mostly due to aerospace product and parts industry. New orders fell 1.6% to $57.4 billion over March 2018 mainly in the petroleum and coal products and aerospace products and parts industries.
PROVINCES
Manufacturing sales were up in four provinces in April 2018. Saskatchewan had the largest month-over-month seasonally adjusted growth at 6.7% while the sharpest decline was in Prince Edward Island at -8.6 per cent. Nova Scotia reported growth of 3.4 per cent.
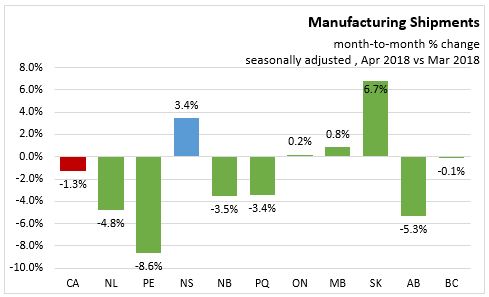
On a seasonally adjusted year-over-year basis, manufacturing shipments are up 3.6% in Canada, with eight provinces recording positive year-over-year growth. Nova Scotia reported the fastest year-over-year increase with growth of 20.8 per cent. Manufacturing shipments were lower in Prince Edwards Island (-4.3) and Alberta (-2.4%).

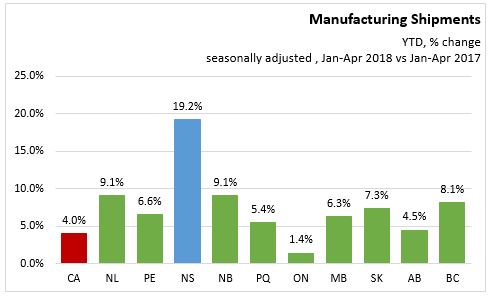
On a seasonally adjusted, year-to-date basis, manufacturing shipments growth was positive in all provinces. Canada reported +4.0% growth compared with the first four months of 2017. The largest gains were reported in Nova Scotia (+19.2%), followed by Newfoundland and Labrador (+9.1%) and New Brunswick (+9.1%).
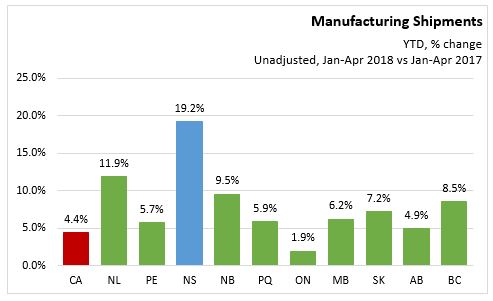
YEAR-TO-DATE UNADJUST DATA
On an unadjusted year-to-date basis, manufacturing shipments growth was positive in all provinces. Canada reported +4.4% growth and Nova Scotia was up 19.2 per cent.
SOURCES
Statistics Canada Manufacturing Shipments April 2018
Table 16-10-0047-01 Manufacturers' sales, inventories, orders and inventory to sales ratios, by industry (dollars unless otherwise noted)
Table 16-10-0048-01 Manufacturing sales by industry and province, monthly (dollars unless otherwise noted) (x 1,000)
<--- Return to Archive