The Economics and Statistics Division maintains archives of previous publications for accountability purposes, but makes no updates to keep these documents current with the latest data revisions from Statistics Canada. As a result, information in older documents may not be accurate. Please exercise caution when referring to older documents. For the latest information and historical data, please contact the individual listed to the right.
<--- Return to Archive
For additional information relating to this article, please contact:
June 14, 2018NATIONAL BALANCE SHEET ACCOUNTS, Q1 2018 
In the first quarter of 2018, Canadian national net worth increased 1.6 per cent (or $176.4 billion) to $11,376 billion. Canada's net foreign asset position increased $110.1 billion to a record $544.2 billion in Q1 reflecting upward revaluation effect of a depreciating Canadian dollar as 97% of international assets and 40% of international liabilities are denominated in foreign currencies. On a per capita basis, national net worth increased to $307,036 at the end of the quarter.
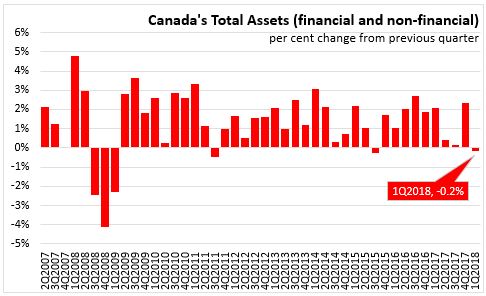
Total assets, including financial and non-financial assets decreased by 0.2 percent to $36.7 trillion at the end of the first quarter 2018. Total financial assets decreased by 0.5 per cent.
Household sector
In the first quarter 2018, Canada’s household sector net worth at market value decreased 0.2 per cent to $10.9 trillion, the first decrease since Q3 2015. There was sluggish growth in non-financial assets and a decline in value of financial assets in the household sector. Equity and investment funds posted a decline and residential real estate continued to have weaker growth.
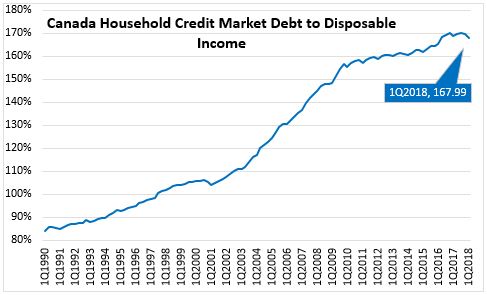
Household borrowing moderate in Q1 with $22.2 billion borrowed compared o $25.4 billion in the previous quarter. Mortgage borrowing decreased to its lowest level since Q2 2014 coinciding with new mortgage regulations and higher interest rates. Total household credit market debt (consumer credit, mortgage and non-mortgage loans) was $2,124.3 billion and as share of disposable income declined from 169.7% to 168.0%.
Government sector
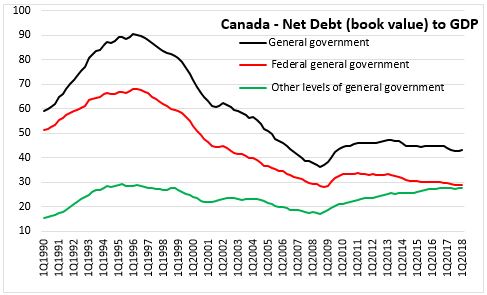
At the end of the first quarter 2018, general government net debt (book value) increased to 43.11 percent of GDP, compared to 43.01 per cent in the previous quarter. The federal government's net debt to GDP ratio increased from 28.82 to 28.91 per cent, while other levels of government saw an increase in net debt to GDP to 27.76 per cent from 27.51 per cent in the previous quarter.
Corporate sector
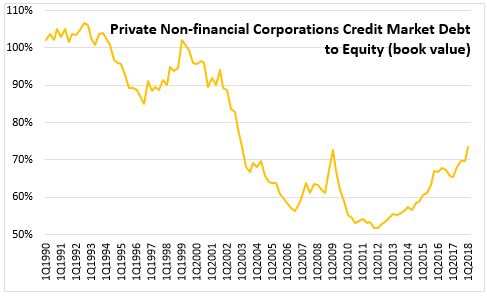
The credit market debt to equity ratio of non-financial private corporations was 73.54 cents of credit market debt for every dollar of equity in the first quarter 2018, up from 69.75 cents in the previous quarter. Demand for funds by non-financial private corporations have returned to lower levels after strong mergers and acquisition activity in the first half of 2017.
Statistics Canada: National Balance Sheet and financial flow accounts
<--- Return to Archive