The Economics and Statistics Division maintains archives of previous publications for accountability purposes, but makes no updates to keep these documents current with the latest data revisions from Statistics Canada. As a result, information in older documents may not be accurate. Please exercise caution when referring to older documents. For the latest information and historical data, please contact the individual listed to the right.
<--- Return to Archive
For additional information relating to this article, please contact:
May 10, 2018NEW HOUSING PRICE INDEX, MARCH 2018 In March, the price of new housing in Nova Scotia rose 0.5 per cent to 101.5, up from 101.0 for the past three months. Canada's new housing price index remained at 103.1.
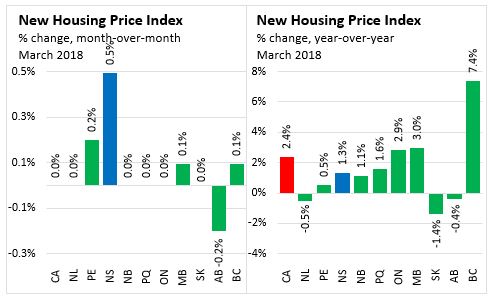
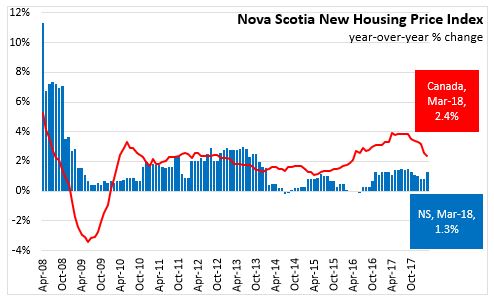
Nova Scotia new housing prices were 1.3 per cent higher than they were in March 2017. National housing prices were up 2.4 per cent, year-over-year.
Across Canada, British Columbia (+7.4 per cent) saw the largest increases in new housing prices from March 2017 to March 2018, followed by Manitoba (+3.0 per cent) and Ontario (+2.9 per cent). Newfoundland and Labrador, Saskatchewan and Alberta reported year over year declines in new housing prices.
Year-over-year growth in the Nova Scotia new housing price index was over 1.0 per cent through 2017, though well below the national average. With this month's result, Year-over-year growth for Nova Scotia has once again returned to above 1.0 per cent this month, after two months of 0.8 per cent growth.
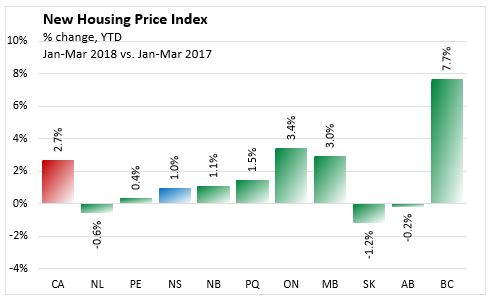
Year-to-date, new housing prices were up 1.0 per cent in Nova Scotia compared to the same period last year. National housing prices were up 2.7 per cent in the first three months of 2018 compared to the same months in 2017. British Columbia saw the fastest growth (+7.7 per cent) while Saskatchewan had the largest decline (-1.2 per cent).
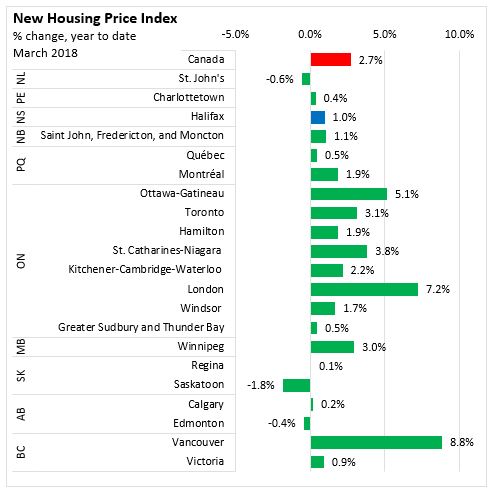
Census Metropolitan Areas
Comparing the first three months of 2018 with the same period in 2017, price growth among Census Metropolitan Areas was fastest in Vancouver, London, Ottawa-Gatineau, and St. Catharines-Niagara. New housing prices have declined in St. John's, Saskatoon, and Edmonton.
Statistics Canada Note: With the release of the January 2017 NHPI data, a number of important changes have been introduced to increase the relevance of the index series. The index base period, for which the NHPI equals 100, is now December 2016. The NHPI basket has been updated with new weights for the 2017 series, its coverage has been expanded to include new CMAs and new indexes have been published for the Toronto, Ottawa and Greater Sudbury areas. Data for periods prior to January 2017 have been obtained by linking the new NHPI series, where possible, with indexes in CANSIM table 327-0046.
Source Statistics Canada, CANSIM table 327-0056
<--- Return to Archive