The Economics and Statistics Division maintains archives of previous publications for accountability purposes, but makes no updates to keep these documents current with the latest data revisions from Statistics Canada. As a result, information in older documents may not be accurate. Please exercise caution when referring to older documents. For the latest information and historical data, please contact the individual listed to the right.
<--- Return to Archive
For additional information relating to this article, please contact:
May 03, 2018NOVA SCOTIA - INTERNATIONAL MERCHANDISE TRADE MARCH 2018 Year-to-Date (Jan-Mar 2018 vs. Jan-Mar 2017, customs-based, unadjusted)
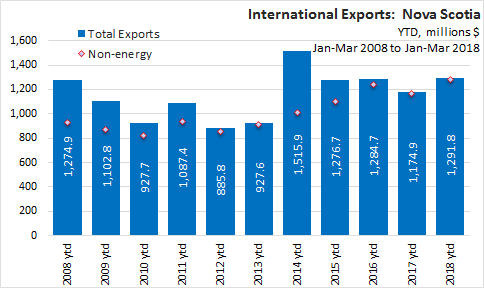
In Jan-Mar 2018, Nova Scotia merchandise trade exports increased $116.9 million (9.9 per cent) over Jan-Mar 2017.
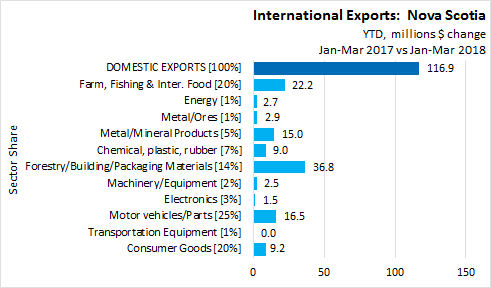
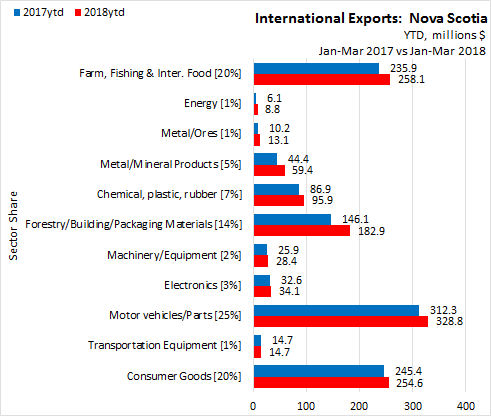
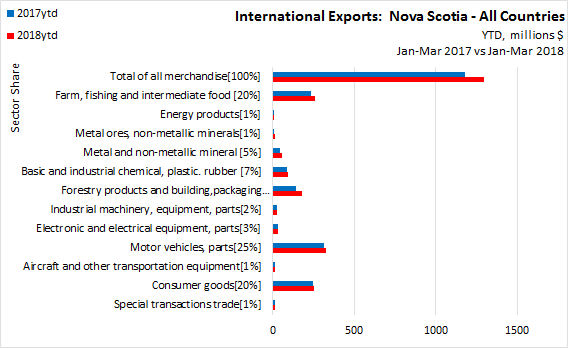
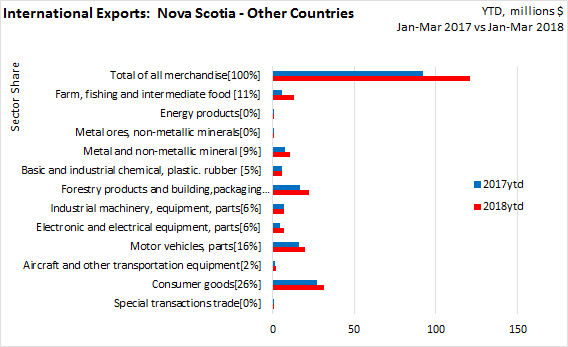
YTD - By Sector
Comparing Nova Scotia's exports for Jan-Mar 2018 with the same period in 2017, the largest dollar value increase were in forestry (+$36.8 million), farm/fishing/intermediate food products (+$22.2 million), and motor vehicles and parts (+$16.5 million). Energy products were up $2.7 million, but now make up a relatively small portion of Nova Scotia's exports.
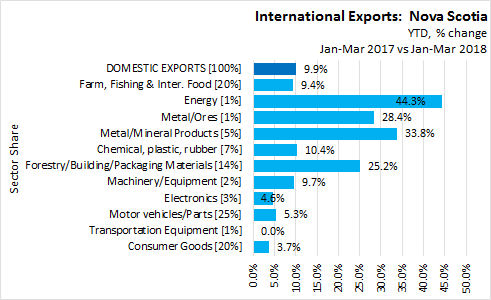
On a year-to-date basis, exports values increased in:
- Forestry products and building and packaging materials by 25.2% ($36.8 million)
- Farm, fishing and intermediate food products by 9.4% (+$22.2 million)
- Metal and non-metallic mineral products by 33.8% ($15.0 million)
- Industrial machinery, equipment and parts by 9.7% (+$2.5 million)
- Basic and industrial chemical, plastic and rubber products by 10.4% (+$9.0 million)
- Energy products by 44.3% (+$2.7 million)
- Consumer goods by 3.7% (+$9.2 million)
- Metal/Ores by 28.4% (+$2.9 million)
- Motor vehicles and parts by 5.3% (+$16.5 million)
- Electronic and electrical equipment and parts by 4.5% (+$1.5 million).
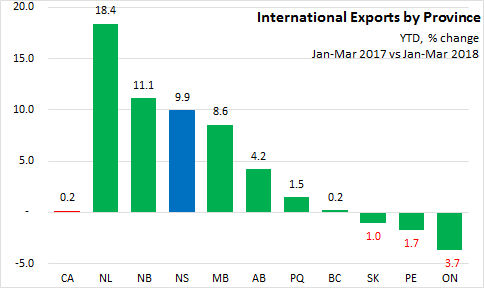
YTD by Province
In Jan-Mar 2018, Newfoundland and Labrador reported the highest increase (+18.4%) in merchandise trade exports over Jan-Mar 2017. Nova Scotia reported the third largest gain (+9.9%) in merchandise trade exports. The Canadian average was a 0.2% increase in merchandise trade exports over Jan-Mar 2017. Exports were down for both Ontario (-3.7%), Prince Edward Island (-1.7%) and Saskatchewan (-1.0%).
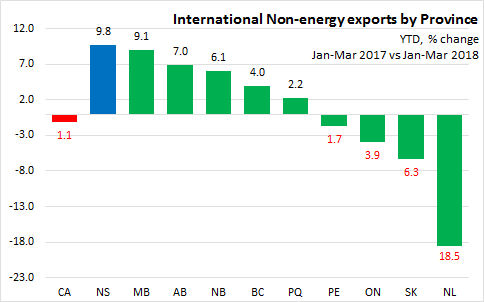
Excluding energy exports, Nova Scotia reported the fastest growth at 9.8%, followed by Manitoba at 9.1%. Newfoundland and Labrador's non-energy exports were down 18.5% while Saskatchewan's were down 6.3%.
YTD Exports by Destination
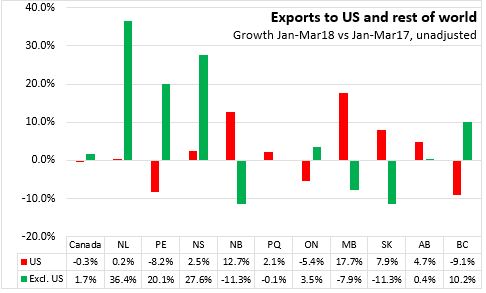
Nova Scotia exports (+2.5%) to the US are up 2.5% in Jan-Mar. Several other provinces also reported export trade to the US on the rise. Only Prince Edward Island, Ontario and British Columbia recorded year-to-date declines. Nova Scotia (+27.6%), Newfoundland and Labrador (+36.4%), and Prince Edward Island (+20.1%) exports to the rest of the world are up subtrantially.
Nova Scotia year-to-date, all country, international exports are only down in two of twelve commodity groups Special transactions and aircraft parts. Overalall export trade is up 10% ($116.9 million over the period.
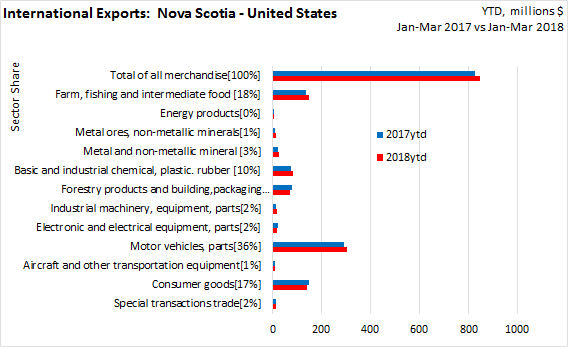
The US is still Nova Scotia's largest export destination (66%), up 2.5% ($20.9 million over Ja-Mar 2017. Farm, fishing and intermediate food increased $13.9 million over the same period last year.
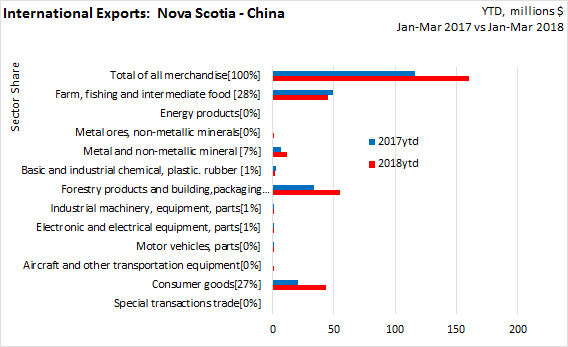
China is Nova Scotia's number two export destinatioin (12% share). Exports were up 38.5% ( $44.6 million) this quarter, with Consumer goods and Forestry products and building,packaging materials leading the way.
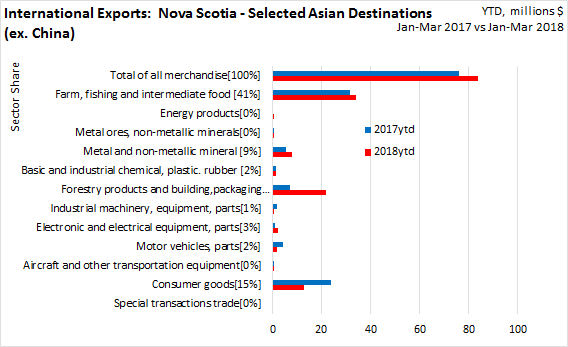
Among other Asian destinations (Japan, South Korea, Taiwan, Hong Kong, Indonesia, Singapore, India), Nova Scotia's exports rose $7.8 million on higher shipments of forestry products.
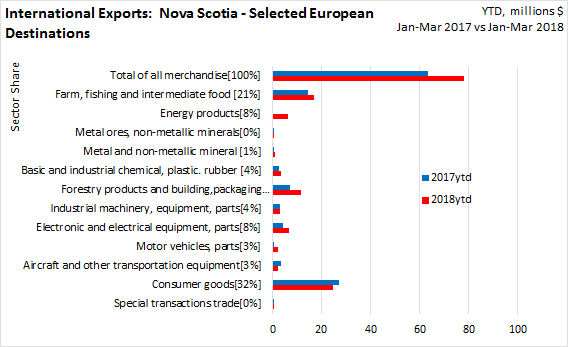
Among Nova Scotia's larger European export markets (UK, France, Germany, Spain, Italy, Netherlands, Belgium), exports increased by $14.6 million on rising exports of energy products, forest products and farm/fish/intermediate food products.
Nova Scotia's exports to other countries were up by $29.0 million mostly on higher shipments of farm/fish/intermediate food products, forest products, machinery/equipment and consumer goods.
Sources: Statistics Canada, CANSIM tables 228-0058 to 228-0068 and 228-0092
<--- Return to Archive