The Economics and Statistics Division maintains archives of previous publications for accountability purposes, but makes no updates to keep these documents current with the latest data revisions from Statistics Canada. As a result, information in older documents may not be accurate. Please exercise caution when referring to older documents. For the latest information and historical data, please contact the individual listed to the right.
<--- Return to Archive
For additional information relating to this article, please contact:
April 17, 2018MANUFACTURING SHIPMENTS, FEBRUARY 2018 Nova Scotia
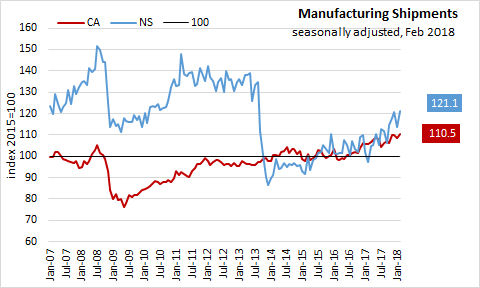
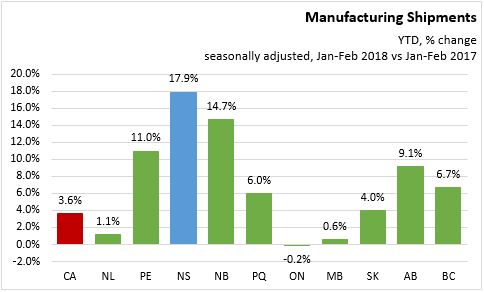
Nova Scotia’s seasonally adjusted manufacturing shipments increased 6.5% in February 2018 to $780 million, and increased 24.3% over February 2017. For the first two months of the year (Jan-Feb), seasonally adjusted manufacturing shipments are 17.9% higher in 2018 than in 2017.
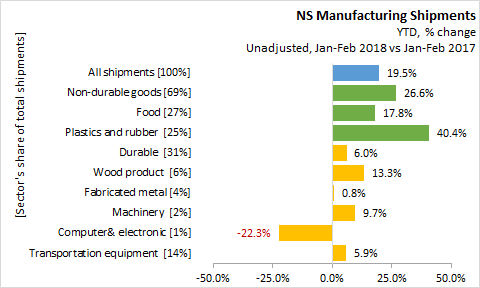
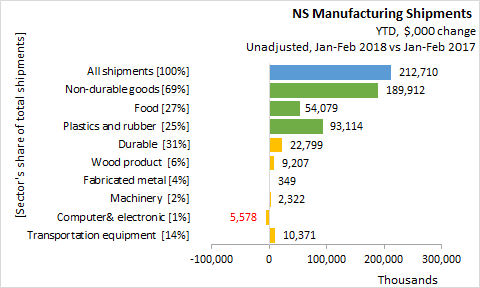
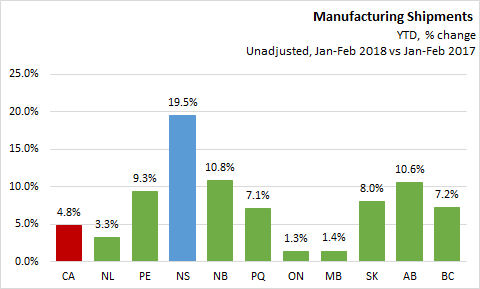
Unadjusted year-to-date (Jan-Feb 2018), All shipments increased 19.5% ($212.7 million) over the same period last year.
- Non-durable goods shipments, accounting for 69% of Manufacturing Shipments, increased 26.6% ($189.9 million),
- Food with a 27% share increased 17.8% ($54.1 million), and
- Plastics and rubber with a 25% share increased 40.4% ($93.1 million).
- Durable goods manufacturing, accounting for 31% of Manufacturing Shipments, increased 6.0% ($22.8 million),
- Wood products, with a 6% share, increased 13.3% ($9.2 million),
- Fabricated metal products, with a 4% share, increased 0.8% ($0.3 million),
- Machinery products, with a 2% share, increased 9.7% ($2.3 million),
- Computer& electronics, with a 1% share, decreased -22.3% ($-5.6 million), and
- Transportation equipment, with a 14% share, increased 5.9% ($10.4 million).
Canada
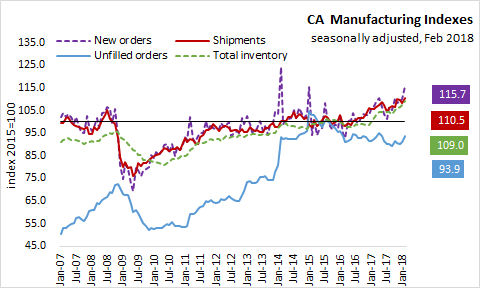
Canada manufacturing sales rose 1.9% to $55.8 billion in February 2018, and are up 4.6% above last year. Compared to January 2018, overall sales increased in 14 of 21 industries as durable goods increased 3.4% and non-durable goods increased 0.3%.
The sales increase was led by increases of 6.6% to $10.7 billion in the transportation equipment industry. Sales were also up in the primary metal manufacturing (+4.8% to $4.3 billion), paper manufacturing (+3.2% to $2.5 billion), and computer and electronics (+5.7 to $1.3 billion).
Increased sales were partially offset by decreases in petroleum and coal (-2.1% to $5.8 billion).
Inventory levels increased 1.3% in February 2018 to $77.4 billion. The Inventory to sales ratio decreased from 1.40 to 1.39. Unfilled orders increased 3.0% to $89.7 billion, and new orders increased 5.0% to $58.4 billion over January 2018.
Provinces
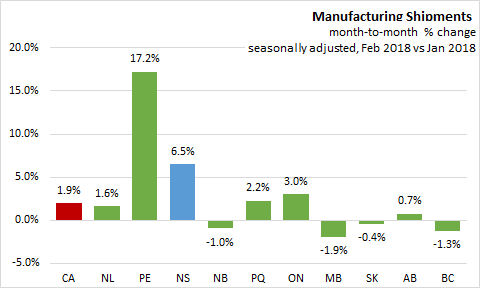
Manufacturing sales were up in six provinces in February 2017. Prince Edward Island had the largest month-over-month seasonally adjusted growth at 17.2%. Nova Scotia reported growth increased 6.5%. The Canadian average was 1.9%.
On a year-over-year basis (seasonally adjusted), manufacturing shipments are up 4.6% in Canada, with nine provinces recording positive year-over-year growth. Prince Edward Island (+26.8%) reported the fastest growth. Nova Scotia reported manufacturing shipments increased 24.3% over February 2017.

On an unadjusted year-to-date basis, manufacturing shipments growth was positive in all provinces. Canada reported +4.8% growth compared with the first two months of 2017. The largest gains were reported in Nova Scotia (+19.5%), with notable gains in New Brunswick (+10.8%), and Alberta (+10.6%).
Statistics Canada Manufacturing Shipments December 2017 and CANSIM 304-0015 and 304-0014
<--- Return to Archive