The Economics and Statistics Division maintains archives of previous publications for accountability purposes, but makes no updates to keep these documents current with the latest data revisions from Statistics Canada. As a result, information in older documents may not be accurate. Please exercise caution when referring to older documents. For the latest information and historical data, please contact the individual listed to the right.
<--- Return to Archive
For additional information relating to this article, please contact:
April 09, 2018MANUFACTURING, ANNUAL 2017 REVIEW 
Manufacturing shipments grew by 4.4 per cent in Nova Scotia in 2017. This is the third consecutive year of growth in manufacturing shipments for the province, driven by growth in non-durable goods industries.
Canadian manufacturing shipments grew by 5.9 per cent in 2017. Across the country, Newfoundland and Labrador had the strongest growth at 25.1 per cent, followed by New Brunswick at 16.2 per cent. Ontario had the slowest annual growth at 1.7 per cent.
NOVA SCOTIA SECTORS
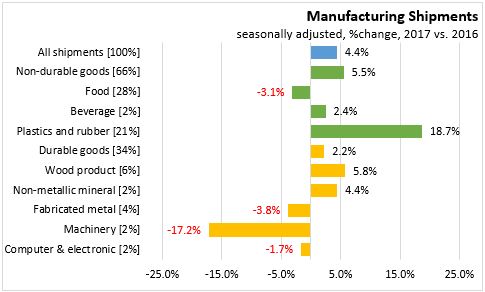
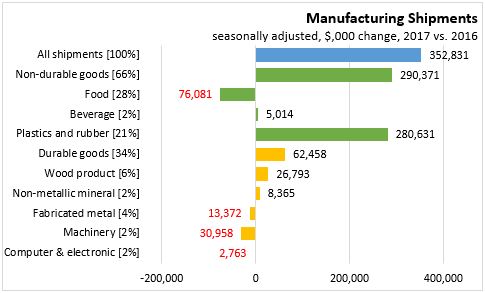
In 2017, seasonally adjusted manufacturing shipments increased 4.4 per cent ($353.8 million) over 2016:
Non-durable goods shipments account for 66% of Manufacturing Shipments and increased 5.5 per cent ($290.4 million)
- Food with a 28% share decreased 3.1 per cent (-$76.1 million)
- Beverage with a 2% share increased 2.4 per cent ($5.0 million)
- Plastics and rubber with a 21% share increased 18.7 per cent ($280.6 million)
Durable goods shipments account for 34% of Manufacturing Shipments and increased 2.2 per cent ($62.5 million)
- Wood product with a 6% share increased 5.8 pe rcent ($26.8 million)
- Non-metallic mineral with a 2% share increased 4.4 per cent ($8.4 million)
- Fabricated metal with a 4% share decreased -3.8 per cent (-$13.4 million)
- Machinery with a 2% share decreased -17.2 per cent (-$31.0 million)
- Computer & electronic with a 2% share decreased 1.7 per cent (-$2.8 million)
EMPLOYMENT
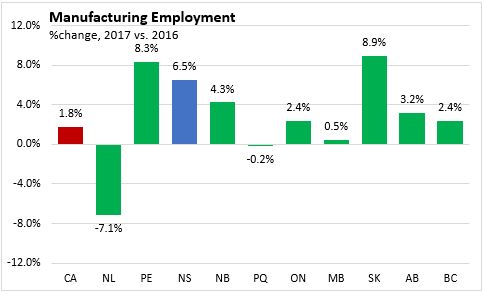
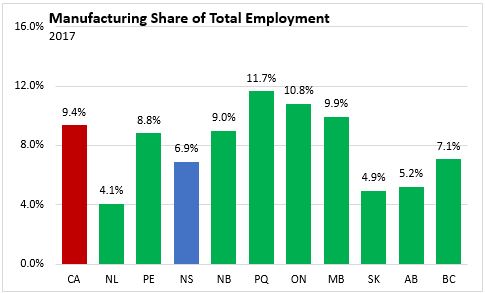
Manufacturing employment grew by 6.5 per cent in Nova Scotia in 2017. Saskatchewan (8.9 per cent) and Prince Edward Island (8.3 per cent) had the strongest growth. According to the Labour Force Survey, manufacturing jobs made up 6.9 per cent of total employment in Nova Scotia in 2017. Newfoundland and Labrador had the lowest share of manufacturing employment and saw the largest decline (-7.1 per cent). The highest share was in Quebec (11.7 per cent) where manufacturing employment was nearly unchanged in 2017.
Statistics Canada Study: Manufacturing: The year 2017 in review and CANSIM 304-0015, 304-0014 and 282-0022
<--- Return to Archive