The Economics and Statistics Division maintains archives of previous publications for accountability purposes, but makes no updates to keep these documents current with the latest data revisions from Statistics Canada. As a result, information in older documents may not be accurate. Please exercise caution when referring to older documents. For the latest information and historical data, please contact the individual listed to the right.
<--- Return to Archive
For additional information relating to this article, please contact:
March 20, 2018WHOLESALE TRADE, JANUARY 2018 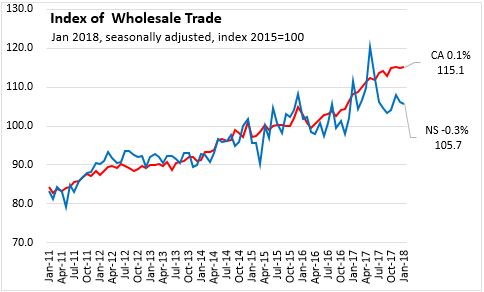
In January 2018, on a seasonally adjusted basis, month-over-month wholesale sales decreased 0.3 per cent to $813 million. The index of growth (2015=100) decreased to 105.7. On a year-over-year basis, wholesale sales were down 5.4 per cent over January 2017.
In Canada, on a seasonally adjusted basis, month-over-month wholesale sales edged up 0.1 per cent to $63.3 billion. The index of growth (2015=100) increased to 115.1. On a year-over-year basis, wholesale sales were 6.4 per cent higher over January 2017.
In Canada, sales were up in four of seven industries month-to-month:
- Food and beverage was up 3.1 per cent to $12.3 billion.
- Machinery and equipment subsector sales were up 1.6 per cent to $13.1 billion.
- Personal and household goods sales were up 0.8 per cent to $8.7 billion.
- Miscellaneous subsector increased 0.2 per cent to $8.0 billion.
- Motor vehicle and parts decreased 1.6 per cent to $11.6 billion.
- Farm product decreased 1.6 per cent to $756 million
- Building materials and supplies sales were down 4.0 per cent to $8.9 billion.
By Province
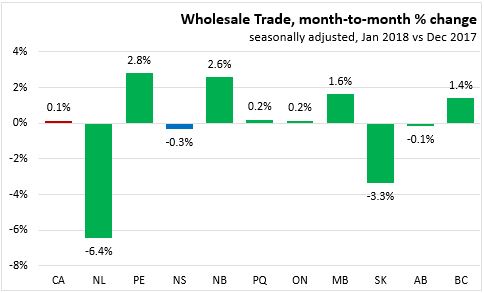
In month-over-month seasonally adjusted wholesale sales, six provinces reported positive-growth. Prince Edward Island reported the strongest growth at 2.8 per cent, while Newfoundland and Labrador reported the largest decline at -6.4 per cent.

On a year-over-year basis, Nova Scotia was the only province to show decline (-5.4 per cent). New Brunswick had the fastest growth, with wholesale trade increasing 11.2 per cent over January 2017.
Nova Scotia Sectors
Statistics Canada now releases seasonally adjusted wholesale trade data by sector at the provincial level. There has been significant volatility in recent wholesale values for Nova Scotia. Year-to-date comparisons are more indicative of economic conditions for volatile indicators and seasonally adjusted wholesale values will also smooth out the indicator. As these results are based on only one month of data, they should be interpreted with caution.
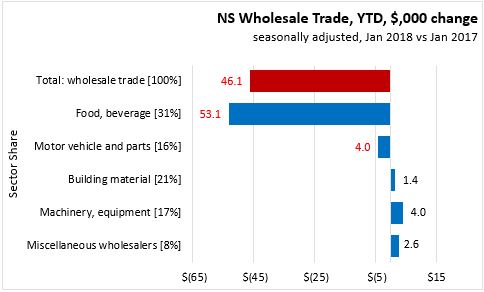
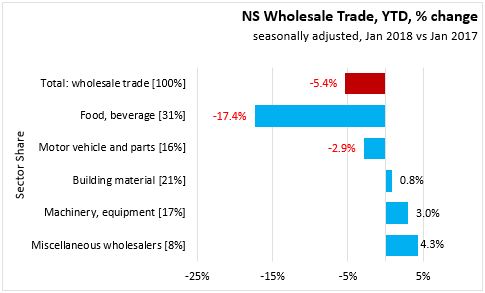
In January 2018, seasonally adjusted total wholesale trade declined 5.4 per cent (-$46.1 million) in Nova Scotia over the same month last year.
- Food, beverage with a 31% share of Wholesale Trade decreased 17.4 per cent (-$53.1 million)
- Motor vehicle and parts with a 16% share decreased 2.9 per cent (-$4.0 million)
- Building material with a 21% share increased 0.8 per cent (+$1.4 million)
- Machinery, equipment with a 17% share increased 3.0 per cent (+$4.0 million)
- Miscellaneous wholesalers with a 8% share increased 4.3 per cent (+$2.6 million)
Statistics Canada: CANSIM table 081-0011
<--- Return to Archive