The Economics and Statistics Division maintains archives of previous publications for accountability purposes, but makes no updates to keep these documents current with the latest data revisions from Statistics Canada. As a result, information in older documents may not be accurate. Please exercise caution when referring to older documents. For the latest information and historical data, please contact the individual listed to the right.
<--- Return to Archive
For additional information relating to this article, please contact:
March 08, 2018BUILDING PERMITS, JANUARY 2018 Building permit data compared on a monthly basis (whether month-over-month or year-over-year) are quite volatile. Although this article compares monthly results, users should be cautious about drawing inferences based on volatile data.
The value of building permits issued in Nova Scotia decreased by 12.7 per cent in January, following a 5.2 per cent increase in December. Residential permits decreased 29.4 per cent and non-residential building permits increased 19.3 per cent. Monthly results for building permits are highly volatile; the six-month moving average of residential permits trended modestly upwards through 2017 but has declined in recent months. The non-residential permits' six-month moving average has remained flat since mid-2017.
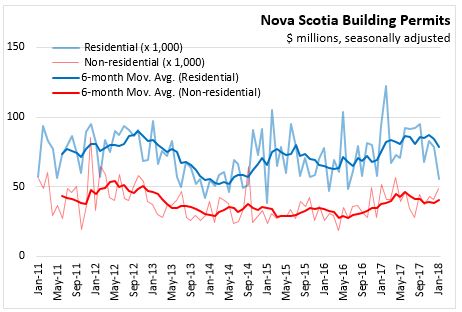
The trend in Nova Scotia building permit values particularly reflects the trends in the Halifax market. The value of Halifax building permits decreased 18.7 per cent in January, reflecting a rise in non-residential (23.0 per cent) permits and a decline in residential (-43.3 per cent). Residential permits in Halifax had been on the rise since mid-2016 with a decline in recent months. Non-residential permits in Halifax have recently peaked and are now trending down.

Outside the Halifax market, building permit values declined 4.6 per cent in January, reflecting a decline in residential permits of 12.6 per cent and an increase in non-residential permits of 13.5 per cent.

Comparing January 2017 to the same month in the previous year, the value of Nova Scotia building permits was down 28.3 per cent largely reflecting a decrease in residential building permits (-41.2 per cent). Non-residential building permits were also down (-4.8 per cent) over January 2017. Non-residential permit declines reflect increases in industrial (+107.1 per cent) and commercial (+8.8 per cent) building permits, with a decline in institutional and government permits (-74.9 per cent). Halifax building permits were down 34.2 per cent over January 2017, while building permits declined outside of Halifax by 20.2 per cent.
In January 2018, the number of dwelling-units created in Nova Scotia was down 263 units over January 2017. This is true for both singles and multiples, in both Halifax and the rest of the province.

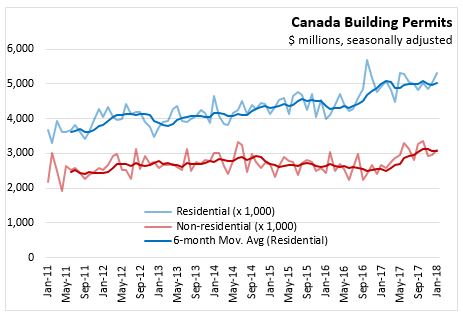
Nationally, residential building permit values were on an upward trend in 2016 but have levelled off since early 2017. Residential building permits increased 5.9 per cent in January. Non-residential building permit values had been trending upward in 2017 after declining through 2015 and 2016 but have peaked in recent months. Non-residential building permits increased 5.0 per cent in January.
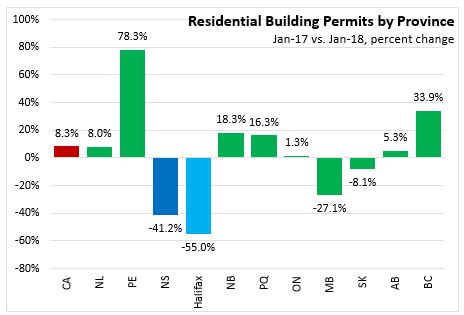
Comparing January 2018 to the same month in 2017, residential building permit values were down in Nova Scotia, Manitoba, and Saskatchewan, while all other provinces observed gains with Prince Edward Island growing fastest (+78.3 per cent).
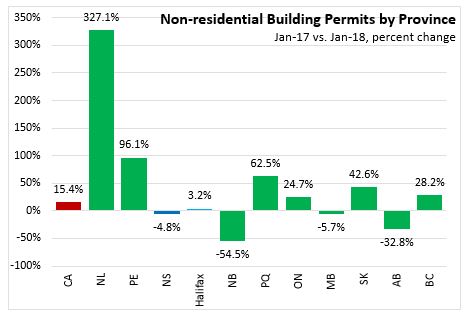
Comparing January 2018 to the same month in 2017, Newfoundland and Labrador had gains of 327.1 per cent over in non-residential building permits. Prince Edward Island had the second largest gains (96.1 per cent). Nova Scotia, New Brunswick, Manitoba and Alberta each had declines, while the remaining provinces reported gains.
Comparing January 2018 to the same month in 2017, Newfoundland and Labrador and Prince Edward Island reported the largest gains in overall building permit values (in percentage terms) followed by British Columbia and Quebec. Nova Scotia, New Brunswick, Manitoba, and Alberta reported declines.

Starting with the reference month January 2018, Statistics Canada has changed how they report building permits. CANSIM Tables 026-0001, 026-0008 and 026-0010 have been combined into 026-0021 which now include data on type of structure and type of work. Statistics Canada no longer report building permits by economic regions, which were previously reported in the DailyStats. There was only one conceptual change regarding the classification of “cottages” based on the permit value, which does not affect how the DailyStats reports single dwelling units.
Sources: CANSIM 026-0021
<--- Return to Archive