The Economics and Statistics Division maintains archives of previous publications for accountability purposes, but makes no updates to keep these documents current with the latest data revisions from Statistics Canada. As a result, information in older documents may not be accurate. Please exercise caution when referring to older documents. For the latest information and historical data, please contact the individual listed to the right.
<--- Return to Archive
For additional information relating to this article, please contact:
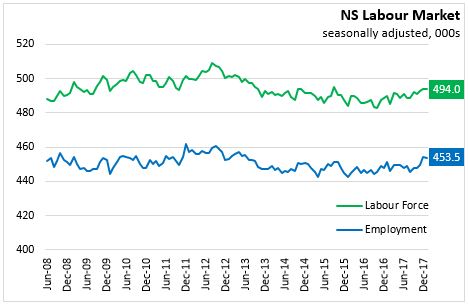
February 09, 2018LABOUR MARKET TRENDS - JANUARY 2018 Nova Scotia's seasonally adjusted employment decreased by 700 to 453,500 in January 2018. This is the first decline reported since August.
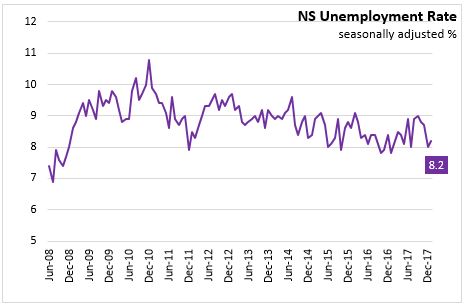
Compared to December, Nova Scotia’s labour force increased slightly by 200 to 494,000 in December. With marginal growth in labour supply and a slight decline in labour demand, the net result was a 0.2 percentage point increase in the seasonally adjusted unemployment rate to 8.2 per cent in January.
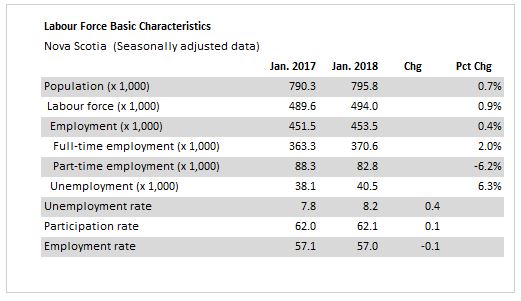
With labour supply increasing and a similar increase in the working age population (+500), the result was an unchanged participation rate of 62.1 per cent in January. The decline in employment lowered the employment rate down 0.1 percentage points to 57.0 per cent.
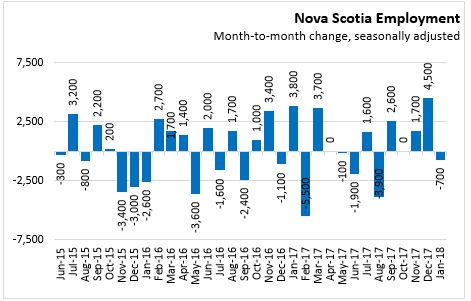
In January, the decrease in employment occurred in part-time employment (-2,100) while full-time employment increased 1,300. Changes in part-time and full-time employment can include the net impacts of changing hours of work within the same position.
Year-to Date (January 2018 vs. January 2017)
Comparing the first month of 2018 to the first month of 2017, there was an increase of 2,000 (0.4 per cent) in the average employment level. Full time employment was up 7,300 while there were 5,500 fewer part-time jobs.
The labour force was up 4,400 compared to January 2017. With labour supply increasing at a faster pace, the net result was an increase in the average unemployment rate of 0.4 percentage point to 8.2 per cent. The labour force participation rate increased by 0.1 percentage point to 62.1 per cent. The employment rate decreased slightly to 57.0 per cent.
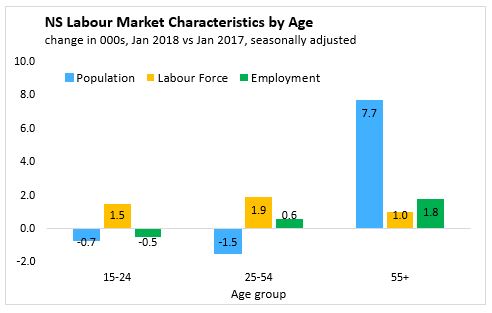
AGE COHORTS
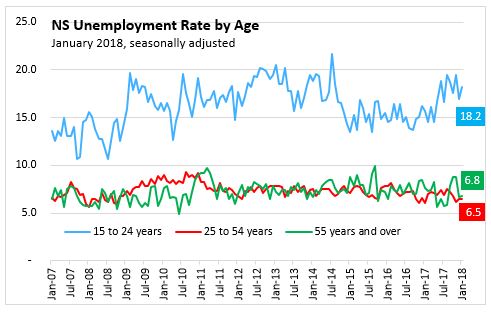
Compared to last month, the youth population (aged 15-24) saw a small decrease in population (-100) while labour force (+1,500) and employment (+400) increased. With labour supply increasing faster than labour demand, the unemployment rate for 15-24 year olds increased from 17.0 per cent in December 2017 to 18.2 per cent in January 2018. Over the past year, the population aged 15-24 has declined 700; however, the labour force has increased 1,500 with the participation rate rising 1.8 percentage points to 64.4 per cent. A rising labour force and a decline in employment resulted in an increase in the unemployment rate among youth from 15.7 per cent in January 2017 to 18.2 per cent in January 2018.
Core aged (25-54) workers reported little month change in January 2018 with a 100 person decline in the labour force and 100 persons increase in employment, the unemployment rate for core aged workers was unchanged at 6.5 per cent. Compared to January 2017, labour force has increased 1,900 with employment rising 600, resulting in an increase in the unemployment rate from 6.1 per cent in January 2017.
Compared to December 2017, the population aged 55 and over in the labour force survey increased by 700. The labour force and employment both decreased by 1,200 for the age group, resulting in a 0.1 percentage point increase in the unemployment rate to 6.8 per cent. Older workers (55+) report the largest population increases over the past year as the baby boomer cohort continues to age into this age group. This puts downward pressure on the size of the labour force and employment in Nova Scotia. In January 2018, the unemployment rate among older workers decreased 0.8 percentage points to 6.8 per cent as employment growth outpaced labour force growth over the past year, but both were notably slower than population increases for this cohort.
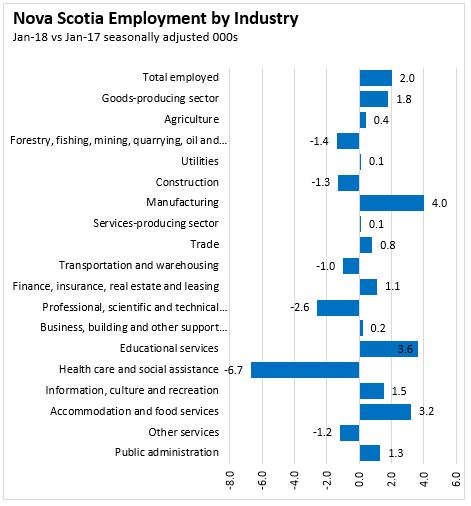
SECTORS
The employment decline of 700 between December 2017 and January 2018 resulted from a decline in private sector employees (-4,200) offsetting increases in public sector employees (+1,100) and self-employed (+2,300). Private sector employees had increased by a total of 8,400 over the previous two months. Among goods-producing sectors, monthly employment increased for forestry, fishing, mining, and oil and gas and manufacturing while declining in construction. Services-producing employment declined 1,700 compared to December 2017 with the largest declines in transportation/warehousing (-1,500), professional, scientific and technical services (-1,400), and information/culture/recreation (-800). Retail/wholesale trade (+1,200) and finance/insurance/real estate (+700) had employment gains compared to last month.
Compared to January 2017, employment in the public sector was lower by 1,800 while private sector employees increased 900 and self-employed was up 2,800.
Comparing January 2018 to January 2017, employment in goods-producing sectors increased by 1,800 jobs. Employment gains occurred in manufacturing (+4,000) and agriculture and utilities while resources (-1,400) and construction (-1,300) are lower compared to January 2017.
Services-producing sector employment is nearly unchanged (+100) compared to January 2017. Employment gains in wholesale/retail trade, finance/insurance/real estate, educational services, information/culture/recreation, accommodation/food services, and public administration offset declines in transportation/warehousing, professional services, and health care/social assistance.
Regions (3 month moving average, January 2018 vs. January 2017)
Comparing the 3-month average ending January 2018 with the 3-months ending January 2017, three regions (Cape Breton, Annapolis Valley, and Halifax) reported labour force growth that outpaced employment growth, resulting in higher average unemployment rates. The North Shore region had employment and labour force both decline compared to January 2017 while the Southern economic region had an increase in labour demand while labour supply declined.
The Cape Breton region reported a 100 job increase and a labour force increase of 300 over January 2017. With labour supply rising more than labour demand, the result was a 0.2 percentage point increase in the unemployment rate to 14.3 per cent.
For the North Shore region, employment decreased 3,300 (-4.7 per cent) for January 2017 compared to January 2017 while the labour force declined 3,000 (-3.9 per cent). The faster decline for employment relative to labour supply resulted in an increase to the unemployment rate to 9.1 per cent.
The Annapolis Valley reported an increase in employment of 4,900 (+9.2 per cent) and an increase in the labour force of 5,600 (9.7 per cent) for January 2018 compared to January 2017. The net result was an increase of 0.3 percentage points in the average unemployment rate to 8.1 per cent.
The Southern region saw an increase of 1,000 (+2.1 per cent) in employment along with a small drop of 300 in the labour force. With employment rising and labour force falling, the unemployment rate was down 2.6 percentage points to 8.6 per cent compared to the January 2017 estimate.
Comparing year over year estimates, Halifax (HRM) experienced an increase in employment of 1,100 (+0.5 per cent) along with an increase in the labour force of 2,600 (+1.1 per cent). With the labour supply growing faster than labour demand, the unemployment rate increased from 5.8 per cent to 6.5 per cent in Halifax.

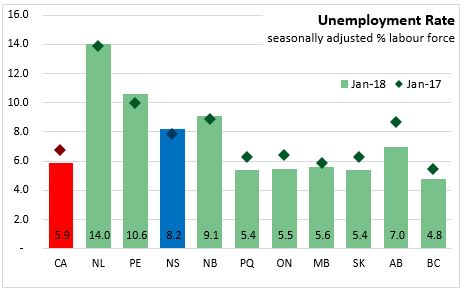
Provincial Comparisons
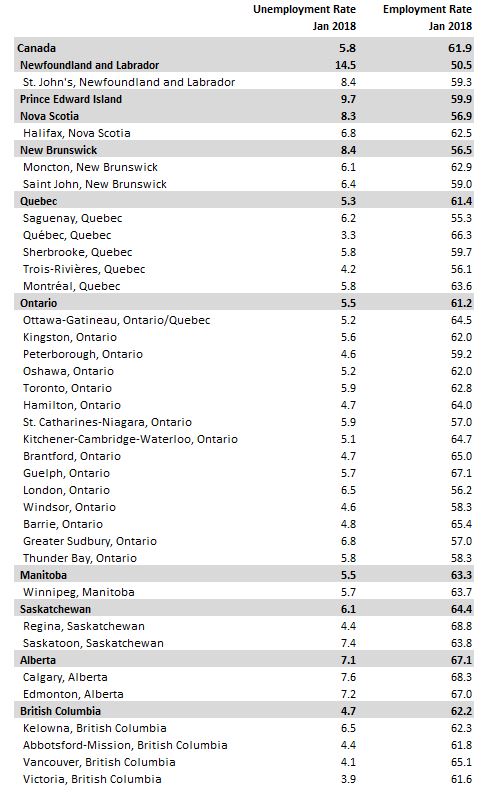
The Nova Scotia unemployment rate was 8.2 per cent in January 2018. In January of last year, the unemployment rate was 7.8 per cent in Nova Scotia. The Canadian unemployment rate was 5.9 per cent, down from 6.7 per cent one year ago. Compared to the same month one year ago, all four Atlantic provinces reported higher unemployment rates, and the other provinces had lower unemployment rates. Alberta had the steepest decline (1.7 percentage points). The lowest unemployment rate among the provinces in January 2018 was in British Columbia (4.8 per cent) while the highest was in Newfoundland and Labrador at 14.0 per cent.
Comparing January 2018 with January 2017, employment increased 1.6 per cent in Canada. Employment grew in eight of the ten provinces, with the largest gains in Prince Edward Island (+2.7 per cent), British Columbia (+2.5 per cent), and Alberta (+2.0 per cent). Employment declined in Newfoundland and Labrador (-1.2 per cent) and New Brunswick (-0.1 per cent).

National Comparisons: Cities
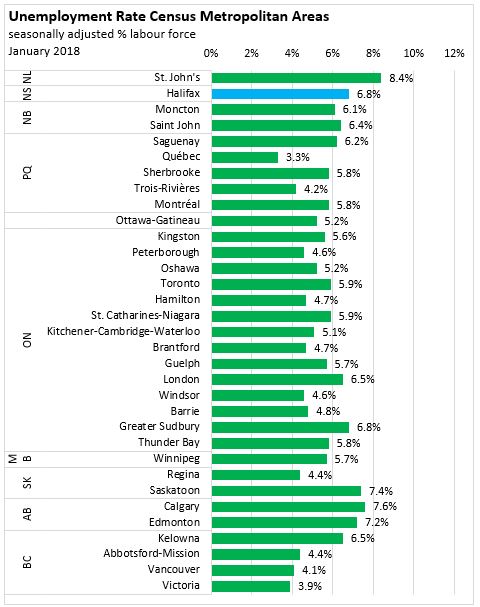
The seasonally adjusted unemployment rate for the Halifax Census Metropolitan Area (CMA) in January was 6.8 per cent. Quebec (3.3 per cent) had the lowest unemployment rate among CMAs in January, while the highest was in St. John’s (8.4 per cent).
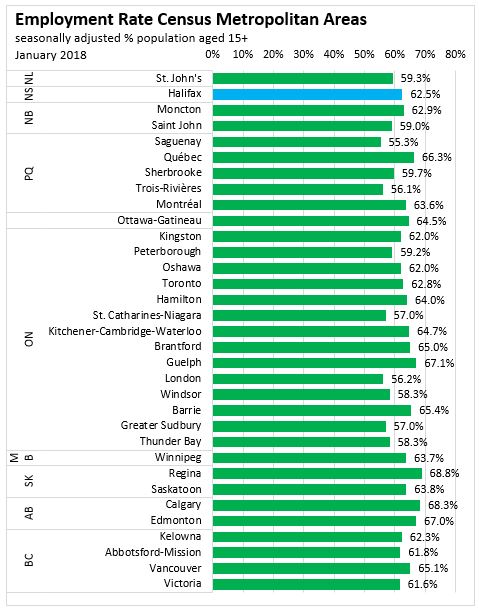
The seasonally adjusted employment rate for the Halifax CMA was 62.5 per cent, up from 62.2 last month. Saguenay had the lowest employment rate (55.3 per cent), while Regina had the highest (68.8 per cent).
The three month average employment ending in January for the Halifax CMA was up 0.7 per cent compared to the three month period ending in December. The largest gain among CMAs was in Windsor, where employment rose by 2.3 per cent.
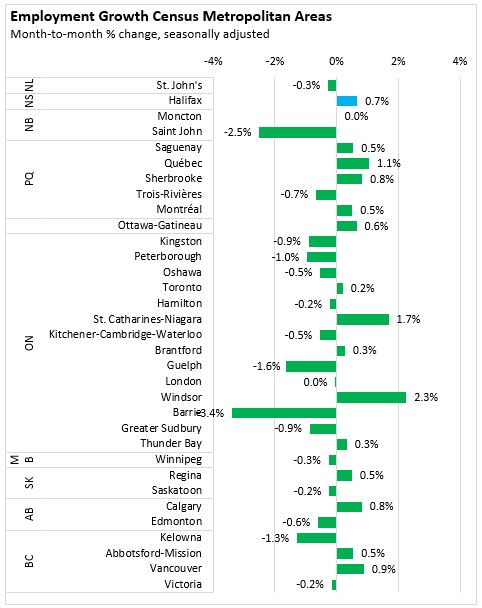
Note: Seasonally adjusted, 3 month average.
<--- Return to Archive