The Economics and Statistics Division maintains archives of previous publications for accountability purposes, but makes no updates to keep these documents current with the latest data revisions from Statistics Canada. As a result, information in older documents may not be accurate. Please exercise caution when referring to older documents. For the latest information and historical data, please contact the individual listed to the right.
<--- Return to Archive
For additional information relating to this article, please contact:
January 23, 2018NON-RESIDENTIAL CAPITAL STOCK REMAINING SERVICE LIFE, 2015 Statistics Canada released data on the age of the non-residential capital stock in the provinces. The assets are measured by the "remaining useful service life of non-residential capital stock" which is estimated as a percentage of service life remaining relative to the total service life of the asset. It is measured as the ratio of the average asset age to its expected service life. Changes to the remaining useful service life can come from changes in the investment level or in the investment mix.
CANADA AND PROVINCES
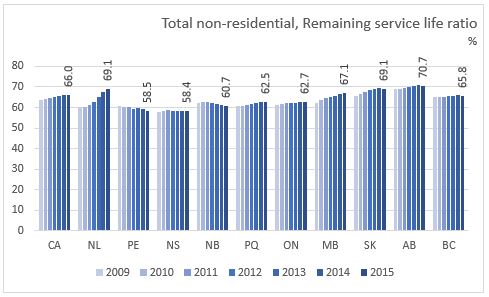
In 2015, the average age of the non-residential capital stock was 9.9 years in Nova Scotia compared to 8.3 years in Canada and youngest capital stock in Saskatchewan and Alberta at 7.6 years. The average age of the capital stock has generally been older and rising in the Maritime provinces over the past several years. The average age of non-residential capital stock has declined for Newfoundland and Labrador, Manitoba, Saskatchewan and Alberta since 2009.

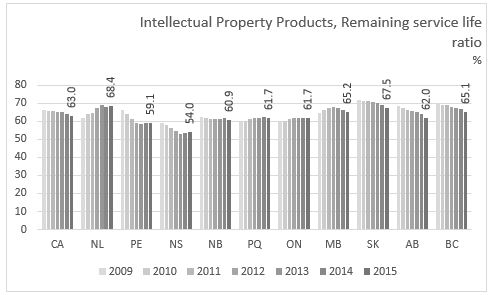
The remaining useful service life ratio for the non-residential capital stock in Nova Scotia was unchanged at 58.4 per cent in 2015. Canada's remaining service life ratio was unchanged at 66.0 per cent in 2015 with increases in Newfoundland and Labrador, Ontario and Manitoba offsetting declines for Prince Edward Island, New Brunswick, Saskatchewan, Alberta and British Columbia.
Since 2009, the remaining useful service life ratio in Nova Scotia has increased by 0.8 percentage points. From 2009 to 2015, the remaining service life ratios had the greatest increases in Newfoundland and Labrador, Manitoba, and Saskatchewan. Smaller increases occurred in Quebec, Ontario, Alberta and British Columbia while Prince Edward Island and New Brunswick saw declines.
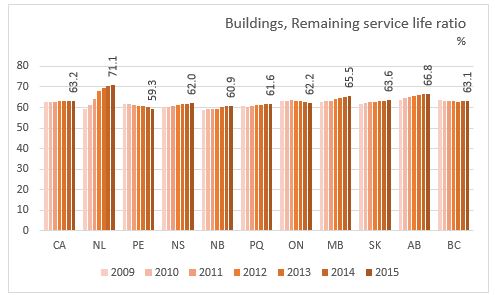
Among asset classes, the remaining service life ratio of buildings has seen little change in Canada since 2009 with a 0.7 percentage increase. Building's remaining useful service life ratios rose in all provinces since 2009 except for Prince Edward Island, Ontario and British Columbia.
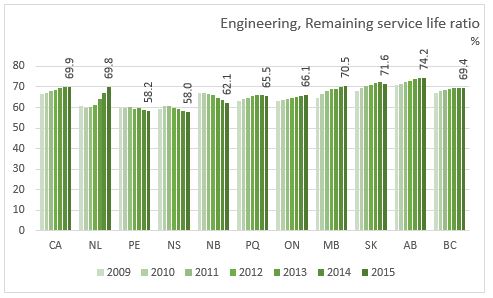
The remaining service life for engineering assets strongly increased in Newfoundland and Labrador (+9.2 pp), Manitoba (+6.0 pp), Saskatchewan (+3.4 pp), Alberta (+3.4 pp) and Ontario (+3.0 pp) since 2009. Declines in the ratio occurred in the Maritime provinces.
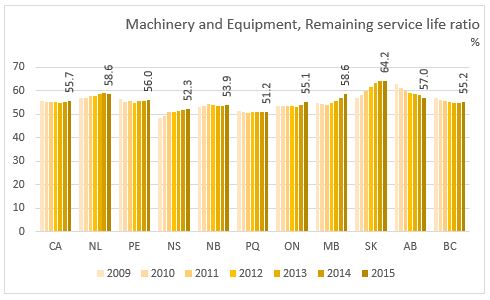
The remaining useful service life ratio for machinery and equipment in Canada was mostly unchanged (-0.1 pp) over the 2009 to 2015 period. Nova Scotia's ratio was up 4.0 percentage points since 2009.
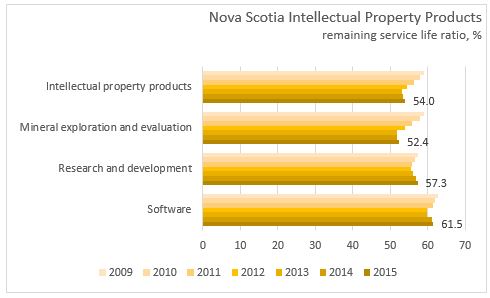
The remaining service life ratio for intellectual property products declined for both Canada and Nova Scotia over 2009 to 2015 period. Most provinces saw declines in the ratio with the exception of Newfoundland and Labrador, Quebec, Ontario and Manitoba.
NOVA SCOTIA
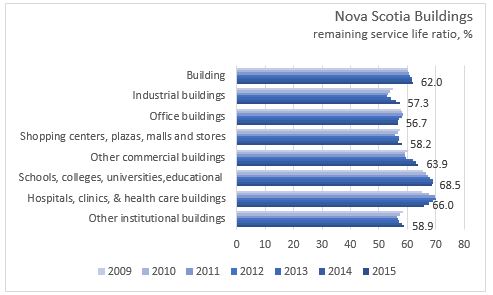
The remaining useful service life ratio of buildings in Nova Scotia was 62.0 per cent in 2015, an increase from 60.1 per cent in 2009. All buildings categories, with the exception of office buildings, have a higher remaining service life ratio compared to 2009.
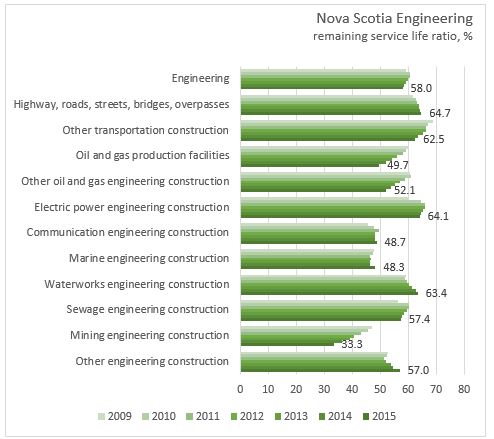
The remaining useful service life for engineering structures in Nova Scotia declined 0.5 percentage points in 2015 to 58.0 per cent and has decreased by 1.3 percentage points since 2009. Aging assets in the oil and gas, mining and other transportation categories have offset improved remaining service life ratios in highways/roads, electric power, waterworks engineering, and other engineering construction.
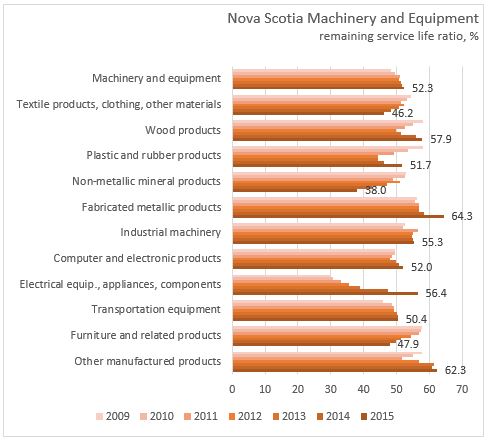
The remaining useful service life for machinery and equipment was up 0.5 percentage points to 52.3 per cent in 2015. For 2015, significant increase in the ratio occurred with plastic and rubber, fabricated metallic products, and electrical equipment, appliances and components.
The remaining useful service life ratio for intellectual property products in Nova Scotia declined from 2009 to 2013 but has increased in 2014 and 2015. The ratio for mineral exploration and evaluation has seen an overall decline of 6.7 percentage points since 2009. Research and development and software have increased by 0.5 percentage points since 2009 to 57.3 per cent and 61.5 per cent respectively.
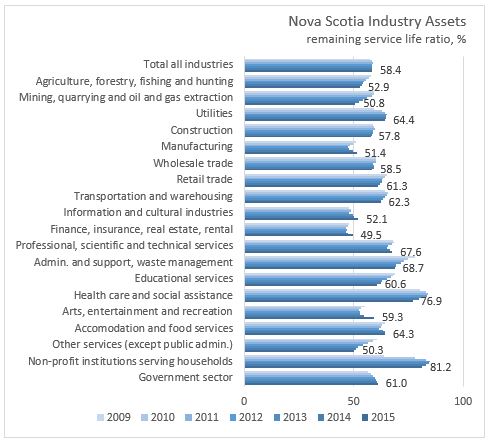
In terms of the non-residential capital stock by sector, the highest remaining useful service life ratios are found in the non-profit sector (81.2%), health care and social assistance (76.9%), administration and support services (68.7%) and professional, scientific and technical services (67.6%).
Statistics Canada: Remaining useful service life ratios of non-residential capital stock, 2015
<--- Return to Archive