The Economics and Statistics Division maintains archives of previous publications for accountability purposes, but makes no updates to keep these documents current with the latest data revisions from Statistics Canada. As a result, information in older documents may not be accurate. Please exercise caution when referring to older documents. For the latest information and historical data, please contact the individual listed to the right.
<--- Return to Archive
For additional information relating to this article, please contact:
January 05, 2018NOVA SCOTIA - INTERNATIONAL MERCHANDISE TRADE NOVEMBER 2017 CUSTOMS BASIS
Unadjusted
Year-to-Date (January-November 2017 vs. January-November 2016)- All merchandise
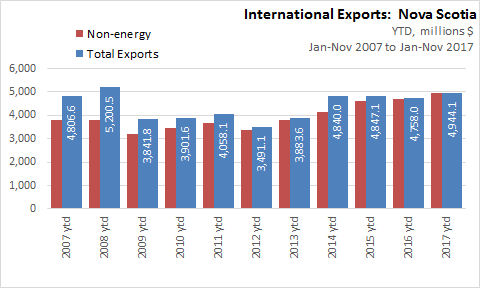
In Jan-Nov 2017, Nova Scotia merchandise trade exports increased $186.1 million to $4.9 billion over Jan-Nov 2016.
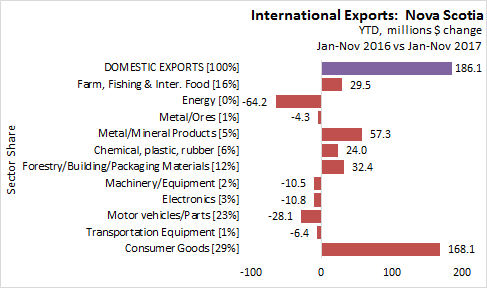
YTD - By Sector
In Nova Scotia for January-November 2017, merchandise exports grew 3.9 per cent or $186.1 million compared to the same months in 2016. The largest dollar value increase were in consumer goods (+$168.1 million), metal/mineral products (+$57.3 million), and forestry products (+$32.4 million). Energy products declined $64.2 million compared to the same period in 2016.
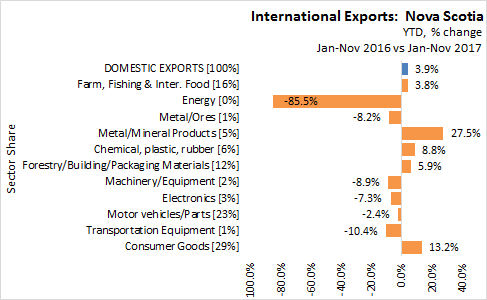
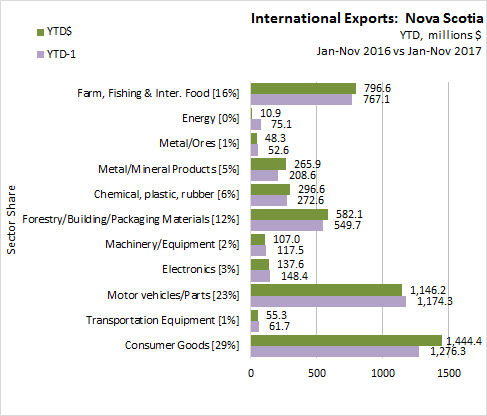
On a year-to-date basis, exports values increased in:
- Consumer goods by 13.2% ($168.1 million) to $1.4 billion
- Metal and non-metallic mineral products by 27.5% ($57.3 million) to $265.9 million
- Forestry products and building and packaging materials by 5.9% ($32.4 million) to $582.1 million
- Basic and industrial chemical, plastic and rubber products by 8.8% ($24.0 million) to $296.6 million
- Farm, fishing and intermediate food products by 3.8% (+$29.5 million) to $796.6 million.
On a year-to-date basis, exports values decreased in:
- Energy products by 85.5% (-$64.2 million) to $10.9 million,
- Motor vehicles and parts by 2.4% (-$28.1 million) to $1.146 billion,
- Electronic and electrical equipment and parts by 7.3% (-$10.8 million) to $137.6 million,
- Metal/Ores by 8.2% (-$4.3 million) to $48.3 million,
- Industrial machinery, equipment and parts by 8.9% (-$10.5 million) to $107.0 million,
- Aircraft and other transportation equipment and parts by 10.4% (-$6.4 million) to $55.3 million.
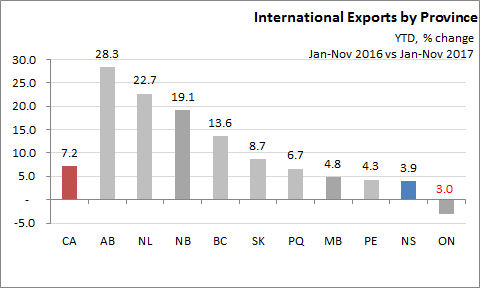
YTD by Province
In Jan-Nov 2017, Alberta ranked first among the provinces in growth of domestic exports. Year-to-date exports increased 28.3 per cent over the same period last year. Canadian year to date exports are up 7.2 per cent.
In Jan-Nov 2017, Nova Scotia ranked ninth among the provinces in growth of domestic exports. Year-to-date exports increased 3.9 per cent over the same period last year.
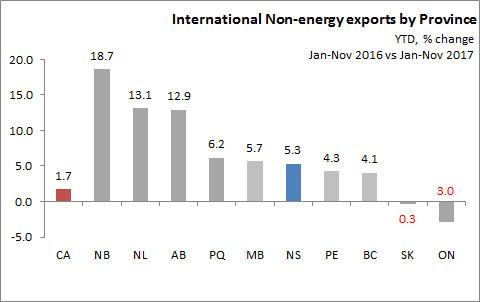
In Jan-Nov 2017, Nova Scotia (+5.3%) ranked 6th among the provinces in non-energy exports over Jan-Nov 2016. Canada non-energy exports have grown 1.7 per cent during this period.
Canada / Provinces Trade with the US and Excluding the US
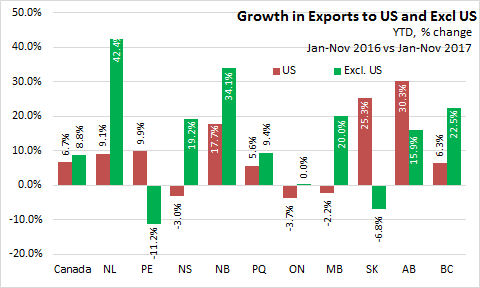
In Canada Jan-Nov 2017, export trade with the United States declined in three provinces (Nova Scotia down 3.0%; Ontario down 3.7%; and Manitoba down 2.2%) over the same period last year.
In Canada Jan-Nov 2017, global export trade excluding the United States was down in two provinces (Prince Edward Island down 11.2%; and Saskatchewan down 6.8%) over the same period last year. Nova Scotia exports to countries other than the US were up 19.2% over the same period last year.
SOURCES
CANSIM tables 228-0058 to 228-0068 , and 228-0080
Publications: List of related Statistics Canada publications
Statistics Canada Daily related to this article.
Canadian international merchandise trade database.
Industry Canada Trade database.
<--- Return to Archive