The Economics and Statistics Division maintains archives of previous publications for accountability purposes, but makes no updates to keep these documents current with the latest data revisions from Statistics Canada. As a result, information in older documents may not be accurate. Please exercise caution when referring to older documents. For the latest information and historical data, please contact the individual listed to the right.
<--- Return to Archive
For additional information relating to this article, please contact:
January 04, 2018NOVA SCOTIA NET TRADE 2016 The trade data in the national economic accounts represent total, international, interprovincial trade in goods and services. From this data one can derive net trade, which is the difference between exports and imports.
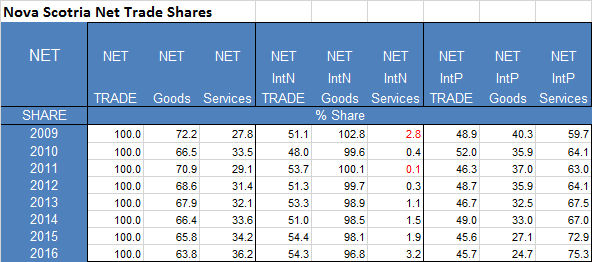
At the higher levels of trade data aggregation, Nova Scotia usually reports more imports of goods and services than exports. With rare exception, the Nova Scotia trade balance is usually a deficit. At lower commodity and/or industry classification, there is a greater mix of trade activity with greater possibility of positive trade balances in some area, but these disaggregates are outside the scope of this analysis.
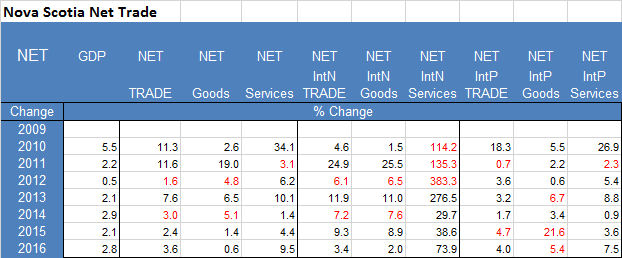
Over the last twenty-four years, Nova Scotia trade deficits have increased in most measures. In some cases, the trade balance is expanding (e.g. international goods 2009-2016) and in others it is deteriorating (e.g. interprovincial goods 2009-2016). The overall balance, however, is negative and total nominal deficits are increasing. The trend of increasing deficits began the recession of 2007-2009, but have accelerated since then.
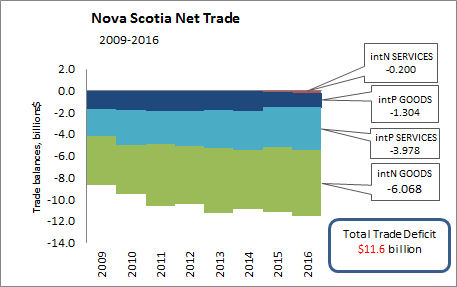
In 2016, Nova Scotia's total trade deficit widened by $405 million to $11.6 billion. Since 2009, the deficit has increased by $3.0 billion. All four trade components were in deficit in 2016. In 2011 and 2009 international services recorded a small surplus.
In 2016, the total goods (international and interprovincial) trade deficit increased 0.6% over 2015 to $7.4 billion.
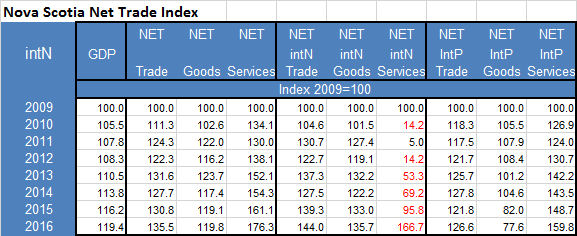
In 2016, the international goods trade deficit increased 2.0% to $6.3 billion over 2015. The net international goods trade deficit index (2009=100) increased 2.7 points over 2015 and 35.7 points over 2009 to 135.7.
In 2016, the interprovincial goods trade deficit narrowed 5.4% to $1.3 billion compared with 2015. The net interprovincial goods trade deficit index (2009=100) declined 4.5 points over 2015 and declined 22.4 points over 2009 to 77.6.
In 2016, the total services (international and interprovincial) trade deficit increased 9.5% to $4.2 billion over 2015.
In 2016, the international services trade deficit increased 73.9% to $0.2 billion over 2015. The net international services trade deficit index (2009=100) increased 70.9 points over 2015 and 66.7 points over 2009 to -166.7.
In 2016, the interprovincial services trade deficit increased 7.5% to $4.0 billion over 2015. The net interprovincial services trade deficit index (2009=100) increased 11.1 points over 2015 and increased 59.8 points over 2009 to 159.8

LONG RUN NET TRADE
The trade data in the national economic accounts represent total, international, interprovincial trade in goods and services. From these data one can derive net trade, which is the difference between exports and imports.
Net Export Trade as a % of GDP
Canada
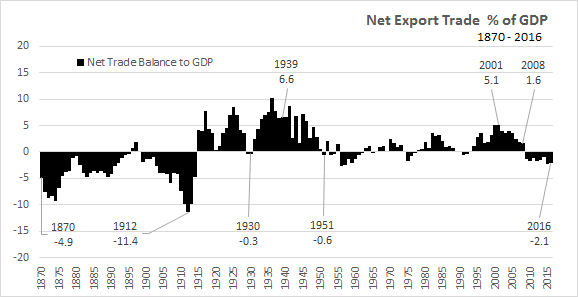
In the period 1870 to the start of World War 1, Canada was a small agrarian nation. The Canadian Net Trade to GDP profile is characterized by long periods of negative trade balances.
In the period 1914 to 1950, Canada reported positive international trade balances in all years, with the exception of 1930.
After 1950, international trade has been characterized by intermittent periods of annual trade deficits and trade surpluses. In 2009, with the collapse of the global trade market, Canada entered a period of annual trade deficits.
Nova Scotia
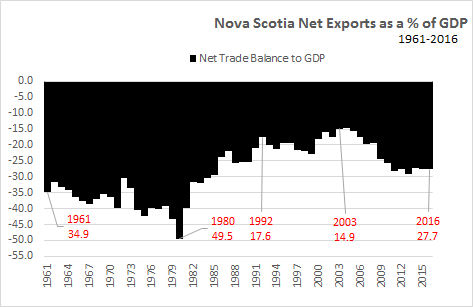
The province does not have as long a time series on GDP and net exports, as does Canada. Available data for the provinces only reaches back to 1961. The “net exports” for the provinces also includes interprovincial net exports, where by definition, the interprovincial net exports would be zero for Canada. As interprovincial trade is roughly half that of international trade, the ratios (net exports to GDP) would be at least twice the magnitude of a Canada calculation.
The aggregation of provincial international trade would have a similar effect to generating a smaller ratio (net exports), as provinces with international trade surpluses would reduce the impact of provinces with international trade deficits.
While the net-exports to GDP ratio for Canada ranged from -12 to +12, the Nova Scotia net-exports to GDP ratio ranged from -50 to -15. The negative and magnitude nature of the indicator should express the inter-dependence of trading partners and the openness of their combined markets.
SOURCES:
STC Daily October 11, 2017.
Analytical Studies Branch Research Paper Series (Catalogue number11F0019M),
Statistics Canada Study: A Long-run Version of the Bank of Canada Commodity Price Index
CANSIM 383-0027.. 383-0028 , 384-0038 and 384-0015
<--- Return to Archive