The Economics and Statistics Division maintains archives of previous publications for accountability purposes, but makes no updates to keep these documents current with the latest data revisions from Statistics Canada. As a result, information in older documents may not be accurate. Please exercise caution when referring to older documents. For the latest information and historical data, please contact the individual listed to the right.
<--- Return to Archive
For additional information relating to this article, please contact:
January 02, 2018NOVA SCOTIA INTERPROVINCIAL TRADE 2016 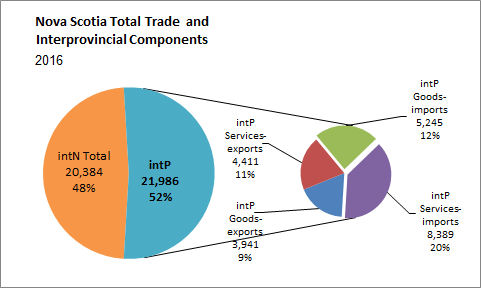
The trade data in the economic accounts represent provincial total and net expenditures in interprovincial (intP) and international (intN) markets. As there are important differences in the characteristics of intN and intP markets, it is useful to provide a separate analysis. In this note, the focus here is on interprovincial (intP) trade.
Several components of intP trade are considered separately and in combination. These include exports, imports, goods, services, total and net trade. Net trade is particularly important as it represents deferred expenditures, either in the form of domestic savings (surplus) or domestic borrowing (deficit). (See Total and Net Trade: published separately)
Total interprovincial trade is the sum of intP imports and exports, goods and services. It is the measure of total trade activity excluding the provincial domestic markets and international markets.
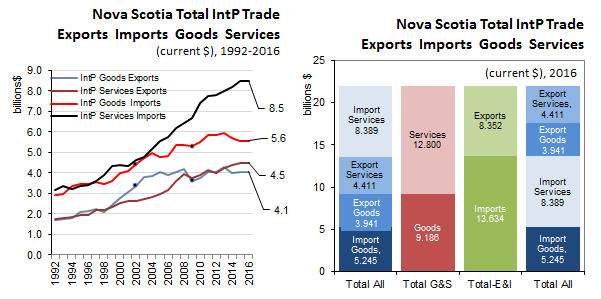
Total intP trade is comprised of four components. In 2016, in order by value, they are: intP services-imports ($8.4 billion); intP goods-imports ($5.2 billion), intP services-exports ($4.4 billion); and intP goods-exports ($3.9 billion). Summed, they total $22.0 billion.
By commodity category: services ($12.8 billion) dominate goods ($9.2 billion). Over 58% of total interprovincial trade value is in the import and export of services, and the remaining 42% is import/export of goods.
By market, imports ($13.6 billion = 62%) dominate exports ($8.4 billion = 38%). As a result, Nova Scotia international trade typically posts in a deficit.
INTERPROVINCIAL TRADE GROWTH
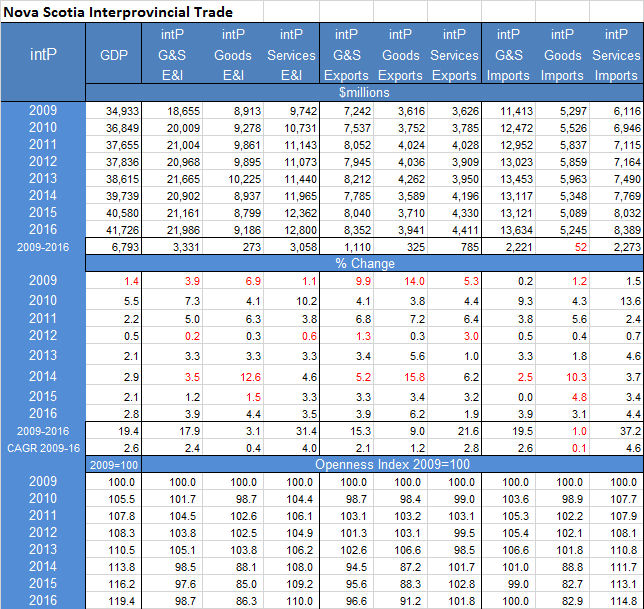
In 2016, Nova Scotia nominal GDP increased 2.8% over 2015 and increased 19.4% (CAGR=2.6%) over 2009, to $41.7 billion
In 2016, total interprovincial trade increased 17.9% (CAGR=2.4%) over 2009, to $22.0 billion. Total intP trade experienced a 3.9% decline coincident with the recession in 2009. Over the 2009-2016 period, GDP annual growth out performed total intP trade growth by 0.2 percentage points per year.
In 2016, total intP exports increased 3.9% over 2015 and increased 15.3% (CAGR= 2.1%) over 2009. Meanwhile, total intP imports increased 3.9% over 2015 and increased 19.5% (CAGR= 2.6%) over 2009. Imports performance was 0.5 points per year better than exports performance over the period.
In 2016, total intP goods increased 4.4% over 2015 and increased 3.1% (CAGR= 0.4%) over 2009. Meanwhile, total intP services increased 3.5% over 2015 and increased 31.4% (CAGR= 4.0%) over 2009. Services trade out performed goods trade over the period.
INTERPROVINCIAL TRADE OPENNESS 2009-2016
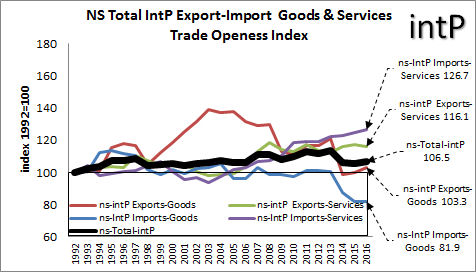
The trade openness index is a measure of the relative change in trade growth to GDP growth. The total interprovincial trade openness index provides evidence to the expansion or contraction of the various interprovincial trade sectors.
In the illustration, one can see that total intP services imports increased by 14.8 points on the trade openness index from 2009 to 2016, and total intP services exports increased 1.8 points over the same period. Total goods imports started off poorly, contracting initially in 2010, then recovering and expanding through 2013. The same happened to total goods exports. Services had its ups and down from 2009 through to 2013. Then goods imports and goods exports went into contraction, ending in 2016 below 100 at 82.9 and 91.2 respectively. Services exports recovered 2014-2016 expanding the market by 1.8 points. Services imports expanded from 2009 through 2016 increasing trade by 14.8 points over the period.

Computed from Statistics Canada CANSIM table 384-0038
<--- Return to Archive