The Economics and Statistics Division maintains archives of previous publications for accountability purposes, but makes no updates to keep these documents current with the latest data revisions from Statistics Canada. As a result, information in older documents may not be accurate. Please exercise caution when referring to older documents. For the latest information and historical data, please contact the individual listed to the right.
<--- Return to Archive
For additional information relating to this article, please contact:
December 28, 2017MERCHANDISE TRADE DIVERSITY BY PROVINCE 2007-2016 Introduction
Canada's provinces are widely exposed to international trade and the income generated from goods exports is a substantial part of nominal GDP. The degree to which each province's goods exports are concentrated in particular commodities and destinations, or diversified across a range of outputs and destinations, signals its exposure to fluctuations in international markets. The normalized Herfindahl-Hirschman Index (HHI) shown below assesses trade concentration and diversity measured on a scale from 0.0, representing complete diversification, to 1.0, representing complete concentration.
While a higher degree of concentration of output exposes a province to fluctuations in a particular market, it can also indicate specialization that allows a province to make the most advantageous terms of trade. For example, Alberta and Newfoundland and Labrador have benefitted from concentrated output in high-valued oil products from 2002 to 2014, but both felt impacts as a result of falling prices over the last 2 years.
Product Diversification
The two-digit Harmonized System (HS) of commodity classification has 97 commodity codes that are used for computing the HHI indexes for Canada and the provinces. Special transactions exports (codes 98 and 99) are not used by Statistics Canada in their HHI calculations.

A provincial HHI score between 0 and 0.1499 would categorize a province as diversified with respect to the international merchandise trade export market. four provinces meet the criteria in 2007 and four provinces meet the criteria in 2016.
A provincial HHI score between 0.15 and 0.2499 would categorize a province as moderately concentrated with respect to the international merchandise trade export market. Over the period 2007-2016, four provinces meet the criteria for at least one year.
A provincial HHI score between 0.25 and 1.0 would categorize a province as concentrated with respect to the international merchandise trade export market. The score suggests that the province's goods exports are concentrated in particular commodity categories. Over the period 2007-2016, three provinces met the criteria over the entire period.
By 2016, Nova Scotia and Saskatchewan had changed classifications in 2016. Nova Scotia was within the diversified band, but has become moderately concentrated in the last two years. For Nova Scotia, exports have become more concentrated in meat/seafood as well as chemical/plastic/rubber products as the share of natural gas and forestry products in the export mix declined. For Saskatchewan falling prices in energy and mineral commodities reduced the relative importance (value) of these products and lowered their HHI score.
From 2007 to 2016 diversity by province followed a pattern of dramatic change for three provinces (Newfoundland, Alberta, and New Brunswick), These provinces specialized in the export of oil and gas to the United States. Falling prices in energy and mineral commodities reduced the relative importance (value) of these products and lowered their respective HHI score.
Ontario started as moderately concentrated, was classified as diversified between 2008 and 2011, then returned to a moderately concentrated status between 2012 and 2016.
Prince Edward Island's international goods exports were classified as moderately concentrated for most of the 2007-2016 period, but the trend was toward increased diversity. By 2015 their status (HHI= 0.1443) was changed to diversified. But the trend was interrupted and the province's exports were reclassified as moderately concentrated (HHI= 0.1684) in 2016.
British Columbia's HHI score was classified as diversified over the period 2007-2016, with some volatility -- ranging from a low of 0.1070 to a high of 0.1459 and closing at 0.1229.
There was virtually no change in the HHI scores for Manitoba and Quebec. Scores ranged from 0.0548 to 0.0635 and 0.0504 to 0.0596 respectively.
Overall, in Canada goods exports (HHI= 0.0933 in 2007; HHI = 0.799 in 2016; high 0.1166 in 2014) to the international market became slightly more diversified over the period.
Market Diversification
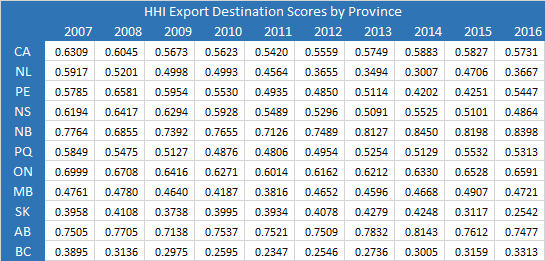
Export destination diversity can also be measured for the country of destination for Canada and its province's international exports. The same methodology is used as for commodities exported to compute the share of Canada/Province international exports received by each country. The HHI (sum of squared shares) score for Canada/Province is computed from these counties share values.
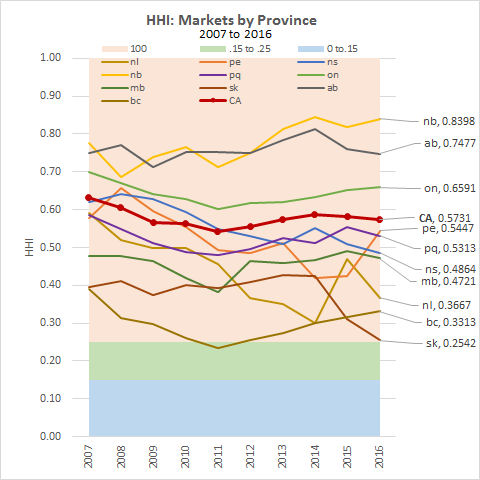
In Canada 2007 to 2016, diversity of export destination by province reveals a different provincial profile than diversity of commodity exports by province.
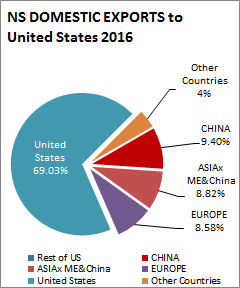
Nine of ten provinces and Canada are classified as concentrated with respect to international exports of goods and the countries of destination. Only one province was classified as moderately concentrated for one year. This is not an unexpected result as a vast majority of Canadian and provincial international exports are destined for the United States. For example, in 2016 about 69% of Nova Scotia international goods exports were destined to the US.
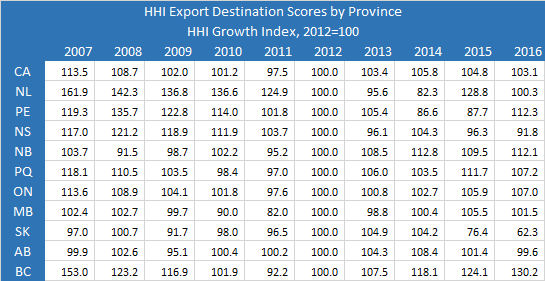
A destination diversity growth index (2012=100) provides some insight to the volatility of the diversity index by province.
British Columbia led the way in most year in destination diversity. Although the province has been classified as destination concentrated, among the provinces, its HHI has been the lowest. Between 2007 and 2011, the province's trend was towards increased destination diversity, and in 2011 the province was classified as destination moderately concentrated. However, after 2011 the province's HHI began to increase and in 2015, Saskatchewan became the most destination diverse province.
Growth in Saskatchewan's destination diversity index has fallen off since 2012. The province recorded in a decline to 62.2 or -37.8 points in 2016 over 2012. The province is currently classified as concentrated with respect to international trade destinations with a HHI = 0.2542, but just on that classification edge. The HHI score has been declining since 2014 -- the start of the oil-gas-mineral commodity price drop.
Nova Scotia is also reporting declining growth in the HHI index since 2012. The provinces HHI growth index for destination diversity has declined 8.2 points since 2012. The HHI destination diversity score was 0.6194 in 2007, and has progressively declined to a score of 0.4864 in 2016. This classifies the province as concentrated, but trending towards diversity.
The only other province that has recorded a destination diversity growth decline since 2012 is Alberta. In 2016, the HHI growth index declined 0.04 points to 99.6. The HHI score classifies the province as concentrated with respect to destination diversity. Scores have ranged from 0.7138 to 0.8143, so destination concentration is high.
New Brunswick currently records the highest destination concentration HHI score at 0.8398 in 2016. The growth index indicates that the HHI increased 12.1 points since 2012. Concentration is increasing.
Prince Edward Island is in the general mix with the other provinces and is classified as destination concentrated. Between 2007 and 2014 it appeared that the province was improving its destination profile as the HHI declined from 0.5785 in 2007 to 0.4202 in 2014. However, the province turned the corner in 2015 with increasing HHI scores. In 2016 the destination concentration number had increased to 0.5547, and the HHI growth index had increased 12.1 points.
All the other provinces (Newfoundland and Labrador = 0.3667, Manitoba = 0.4721, Quebec = 0.5313, Ontario= 0.6591) are classified as concentrated with respect to international exports destinations and destination concentration is increasing.
In Canada 2007 to 2016, destination concentration decreased from 0.6309 to 0.5731. In the short run, 2012-2016, the HHI increased from 0.5559 to 0.5731 (growth index increased 3.1 points). Overall, destination concentration declined over the period but has increased in the short run.
Sources: Statistics Canada CANSIM Table 228-0082, STC Daily December 11, 2017; Article: Measuring Canadian Export Diversification; Trade Data On-line
Authors computations with Trade Data were rounded to 4 decimal places and were reconciled with Statistics Canada data from 228-0082 which were rounded to 2 decimal places.
<--- Return to Archive