The Economics and Statistics Division maintains archives of previous publications for accountability purposes, but makes no updates to keep these documents current with the latest data revisions from Statistics Canada. As a result, information in older documents may not be accurate. Please exercise caution when referring to older documents. For the latest information and historical data, please contact the individual listed to the right.
<--- Return to Archive
For additional information relating to this article, please contact:
December 19, 2017NON-RESIDENT HOME OWNERSHIP, 2017 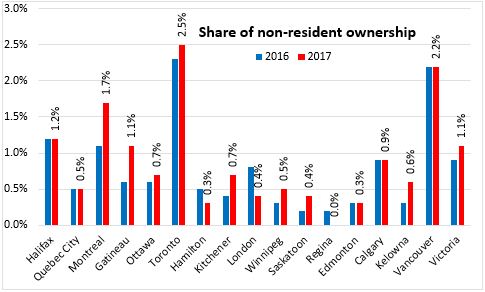
As part of the new Canadian Housing Statistics Program (a joint project with the Canada Mortgage and Housing Corporation), Statistics Canada has released the first tables of new information about the housing market in Canada. Today's release focuses on non-resident ownership of residential property among Census Metropolitan Areas.
In this context, 'non-resident homeowner' refers to an individual whose principal residence is outside of Canada. These owners could be Canadian nationals with a non-Canadian residency. While Statistics Canada's results focus on individual as well as corporate owners in the Toronto and Vancouver markets, the CMHC results look at individual owners of residential properties in a number of Canadian cities.
Non-resident ownership is estimated (in CMHC data) to be highest in the largest urban centres: Toronto, Vancouver and Montreal. This is followed by the share of non-resident ownership in Halifax, Gatineau, Victoria and Calgary.
Statistics Canada's estimates of non-resident ownership (including corporate ownership) attributes 3.4 per cent of residential properties in Toronto to non-residents. Vancouver's non-resident ownership rates are 4.8 per cent of properties. Non-resident ownership is higher for condominiums in both markets.
Source: Statistics Canada, CANSIM table 035-0002; Canada Mortgage and Housing Corporation, Housing Market Insight (December 2017)
<--- Return to Archive