The Economics and Statistics Division maintains archives of previous publications for accountability purposes, but makes no updates to keep these documents current with the latest data revisions from Statistics Canada. As a result, information in older documents may not be accurate. Please exercise caution when referring to older documents. For the latest information and historical data, please contact the individual listed to the right.
<--- Return to Archive
For additional information relating to this article, please contact:
December 15, 2017MANUFACTURING SHIPMENTS, OCTOBER 2017 **CORRECTION - an earlier version of the DailyStats reported incorrect charts for manufacturing shipments by province.**
Nova Scotia
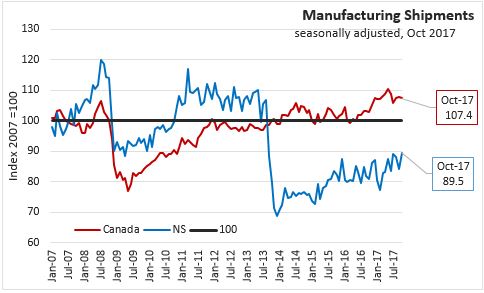
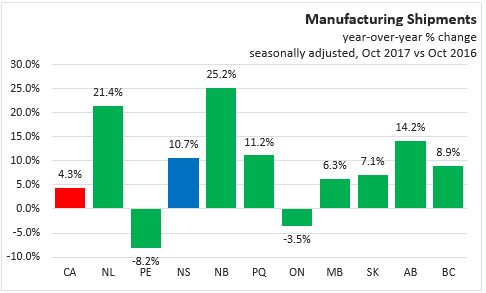
Nova Scotia’s seasonally adjusted manufacturing shipments increased 6.2% in October 2017 to $728 million, and increased 10.7% over October 2016.
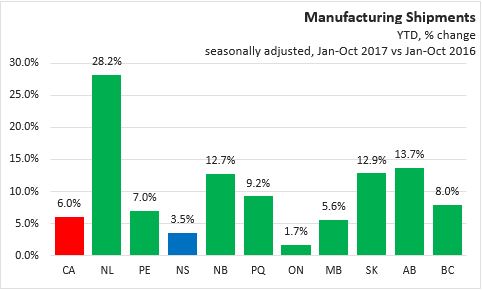
For the first ten months of the year (January-October), seasonally adjusted manufacturing shipments are 3.5% higher in 2017 than in 2016.
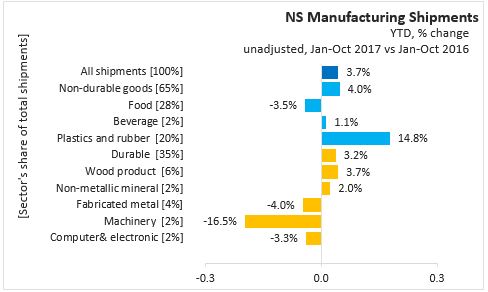
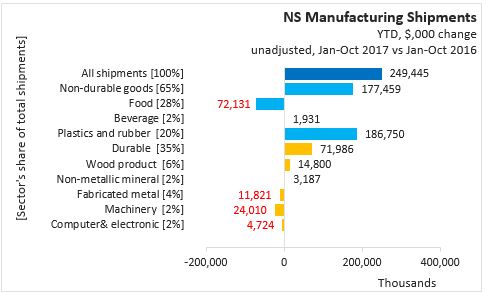
Unadjusted year-to-date (Jan-Oct), all shipments are up 3.7% (+$249 million):
- non-durable shipments account for 65% of manufacturing shipments in 2017 and increased 4.0% over the same period last year.
- Plastic and rubber shipments, with a 20% share, are up 14.8%,
- Beverages and tobacco, with a 2% share, are up 1.1% and
- Food manufacturing, with a 28% share, are down 3.5% over the same period last year.
- durable goods manufacturing accounts for 35% of shipments in 2017, increased 3.2%.
- Wood products, with a 6% share, are up 3.7%,
- Non-metallic mineral products, with a 2% share, are up 2.0%,
- Fabricated metal products, with a 4% share, are down 4.0%,
- Machinery products, with a 2% share, are down 16.5%, and
- Computer and electronics, with a 2% share, are down 3.3%, over the same period last year.
Canada
Canada manufacturing sales were down 0.4% to $53.5 billion in October 2017, and are up 4.3% above last year. Compared to September 2017, overall sales fell in 8 of 21 industries as durable goods decreased 0.9% and non-durable goods increased only 0.1%.

The sales decrease was led by declines of 5.0% to $9.7 billion in the transportation equipment industry. Sales were also down in chemical (-1.1%) and machinery (-1.4%).
Lower sales were partially offset by increases in petroleum/coal (+2.2%) and wood product (+3.4%) industries.
Inventory levels increased in October 2017 to $74.8 billion. The Inventory to sales ratio increased from 1.37 to 1.40. Unfilled orders were increased to $87.3 billion, and new orders increased 5.3% to $55.5 billion over September 2017.
Provinces
Manufacturing sales were up in four provinces in October 2017. Nova Scotia had the largest month-over-month growth at 6.2%.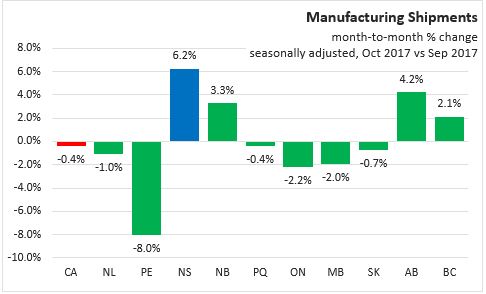
On a year-over-year basis (seasonally adjusted), manufacturing shipments are up 4.3% in Canada, with eight provinces recording positive year-over-year growth. New Brunswick (+25.2%) and Newfoundland and Labrador (+21.4%) reported the fastest growth. Nova Scotia's manufacturing shipments increased 10.7% over October 2016.
On a year-to-date basis, manufacturing shipments growth (seasonally adjusted) was positive in all provinces. Canada reported +6.0% growth compared with the first ten months of 2016. The largest gains were reported in Newfoundland and Labrador (+28.2%), with notable gains in New Brunswick (+12.7%), Saskatchewan (+12.9%) and Alberta (+13.7%). Nova Scotia's manufacturing shipments were up 3.5%.
Statistics Canada Manufacturing Shipments October 2017 and CANSIM 304-0015 and 304-0014
<--- Return to Archive