The Economics and Statistics Division maintains archives of previous publications for accountability purposes, but makes no updates to keep these documents current with the latest data revisions from Statistics Canada. As a result, information in older documents may not be accurate. Please exercise caution when referring to older documents. For the latest information and historical data, please contact the individual listed to the right.
<--- Return to Archive
For additional information relating to this article, please contact:
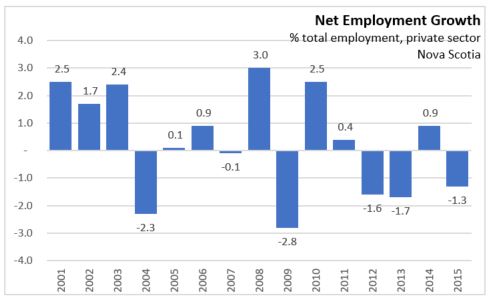
November 30, 2017BUSINESS AND EMPLOYMENT DYNAMICS, 2015 According to the Statistics Canada’s Longitudinal Employment Analysis Program (LEAP) data, an average annual net employment growth in Nova Scotia’s business sector was 0.3 per cent between 2001 and 2015.
Note: LEAP covers incorporated and unincorporated businesses that issue at least one T4 slip in any given calendar year, but excludes self-employed individuals or partnerships where the participants do not draw salaries.
Nova Scotia ranked the 9th among provinces in the average annual net employment growth during this period. Alberta (+2.9%) led the provinces in the average annual net employment growth, followed by BC and Saskatchewan (+1.8%).

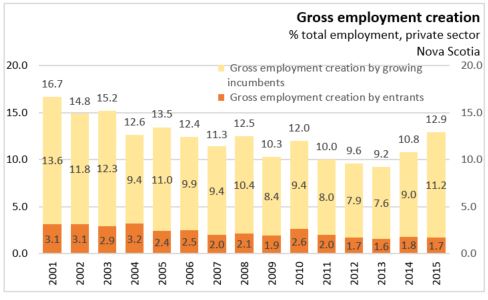
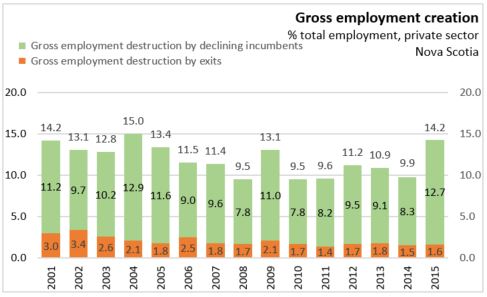
The net employment growth in 2015 is broken down into four subcomponents of gross employment creation and destruction: employment creation by entrants (1.7%), employment creation by growing incumbents (11.2%), employment destruction by exits (1.6%), and employment destruction by declining incumbents (12.7%).
Entrants in any given year are enterprises that have current payroll data, but that did not have payroll data in the previous year. Similarly, exits in any given year are identified by the absence of current payroll data, where such data had existed in the previous year.
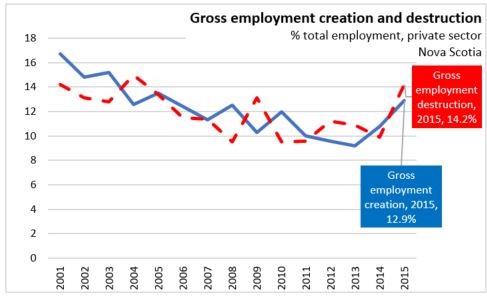
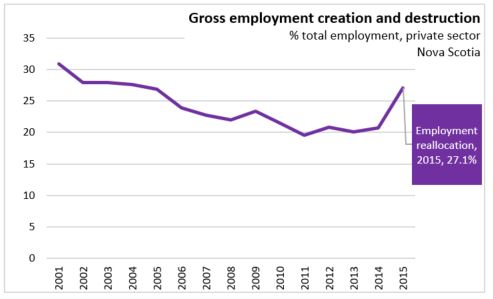
Between 2001 and 2008, gross employment creation and destruction both trended downwards. In 2009, the gross employment destruction rate increased significantly by 3.6 percentage points, while the gross employment creation rate declined by 2.2 percentage points.
In 2010, gross employment destruction declined by 3.6 percentage points, while gross employment creation increased by 1.7 percentage points. This was followed by three years of decline in gross employment creation followed by two years of increases in 2014 and 2015 (1.6 percentage points and tehn 1.9 percentage points). Gross employment destruction increased in 2011 and 2012 and then declined in 2013 and 2014, and has risen sharply by 4.3 percentage points in 2015.
Gross employment creation in Nova Scotia’s private sector slowed down from 13.6 per cent in 2001 to 10.8 per cent in 2014. The main contributor to the decline in gross employment creation was slower employment creation of incumbent firms. In 2014, incumbents contributed 9.0 per cent to employment creation compared to 13.6 per cent in 2001. In 2014, new entrants contributed 1.8 per cent to employment creation, as compared to 3.1 per cent in 2001.
The gross employment destruction declined from 14.2 per cent in 2001 to 9.9 per cent in 2014. Slowing employment destruction by declining incumbents the largest contributor to the decline.
Employment reallocation, which is the sum of gross employment creation and destruction, declined steadily, to 20.7 per cent of total employment in 2014 from 30.9 per cent in 2001. In other words, nearly one in three jobs were either created or destroyed in 2001, while one in five jobs was affected by employment reallocation in 2014.
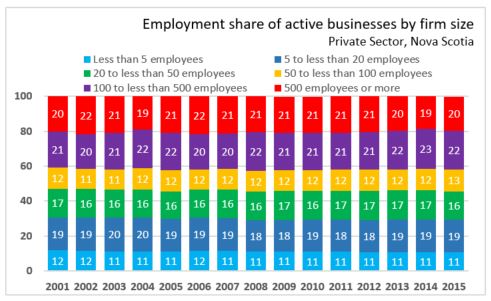
Within the larger business sector, employment share of firms with 100 to less than 500 employees increased from 20.9 per cent in 2001 to 22.1 per cent in 2015. Employment share of firms with 500 or more employees declined from 20.0 per cent in 2001 to 19.5 per cent in 2015. Employment share of firms with 50 to less than 100 employees increased from 12.0 per cent 2001 to 12.7 per cent in 2015.
Within the smaller business sector, employment share of firms with 5 to less than 20 employees declined from 18.9 per cent in 2001 to 18.6 per cent in 2015. Employment share of firms with 20 to less than 50 employees decreased from 16.5 per cent in 2001 to 16.3 per cent in 2015, but was as high as 16.9 per centi n 2014. Employment share of firms with less than 5 employees declined from 11.8 per cent in 2001 to 10.7 per cent in 2015.
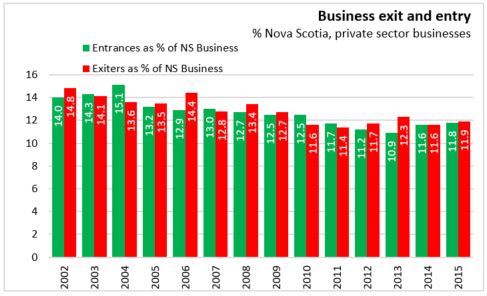
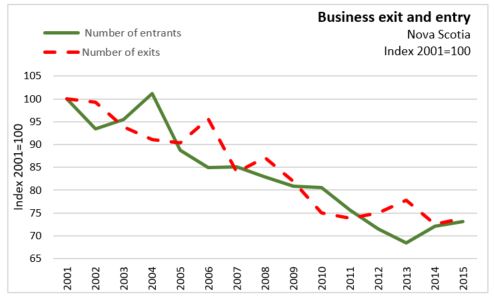
Firm turnover (entry and exit) is very important to business innovation and productivity improvement. Entry rates, measured by the percentage of firms entering the market, declined from 14.0 per cent in 2002 to 11.8 per cent in 2015. Over the same period, the exit rates measured by the percentage of firms exiting the market declined from 14.8 per cent in 2002 to 11.9 per cent in 2015.
Source: Statistics Canada CANSIM Tables 527-0007, 527-0010, 527-0011, 527-0012.
<--- Return to Archive