The Economics and Statistics Division maintains archives of previous publications for accountability purposes, but makes no updates to keep these documents current with the latest data revisions from Statistics Canada. As a result, information in older documents may not be accurate. Please exercise caution when referring to older documents. For the latest information and historical data, please contact the individual listed to the right.
<--- Return to Archive
For additional information relating to this article, please contact:
November 29, 20172016 CENSUS: LABOUR Today, Statistics Canada is releasing data on the Canadian labour market from the 2016 Census, reporting on statistics about Canadians work experiences in the 2015 year.
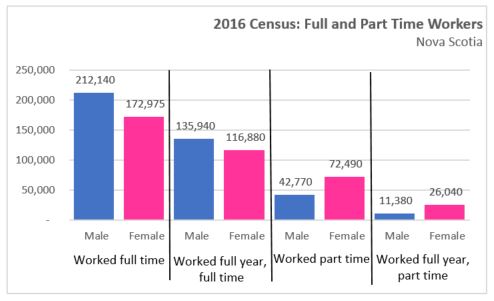
FULL TIME WORK
There were 774,750 Nova Scotians that either worked or did not work during the 2015 reference year (274,375 did not work, and 500,375 worked). Of those, 372,455 (48.1%) were men, and 402,295 (51.9%) were women. Of those who worked, 254,905 (50.9%) were men, and 245,465 (49.1%) were women.
Fifty point five per cent of all workers worked full year, full time, and 7.5 per cent worked part time, full year. More men than women worked full year, full time, and more women than men worked full year, part time.
INDUSTRY
Those aged:
- 15-24 made up 12.3 per cent of all workers;
- 25-34 year olds accounted for 18.7 per cent of workers;
- 35-44 year olds accounted for 20.6 per cent of workers;
- 45-54 year olds accounted for 24.8 per cent of workers;
- 55-64 year olds accounted for 18.7 per cent of workers;
- 65-74 year olds accounted for 4.3 per cent of workers; and,
- 75 year olds and older accounted for 0.5 per cent of all workers
In the reference year, the two largest industries were Health Care and Social Assistance (14.5%) and retail trade (13.0%).

Among those in the 15-24 age cohort, highest employment was in retail trade and accommodation and food services (a combined 47.0 per cent of all employment in that age group). The 25-34 year age group had highest employment in health care and social assistance, followed by retail trade. The 35-44 year age group had highest employment in health care and social assistance, followed by public administration (a combined 26.7%). The 45-54 year age group saw highest employment in health care ans social assistnace, followed by retail trade and public admin (a combined 37.5%). The 55-64 year age group had highest employment in health care and social assistance (14.9%), followed by retail trade. Those over the age of 65 had the highest employment in retail trade, followed by health care and social assistance, and then agriculture and forestry, hunting and fishing.
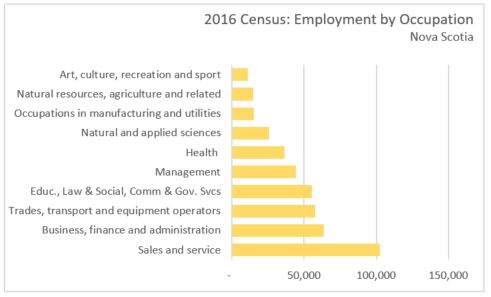
OCCUPATION
The services occupations dominated the Nova Scotia workforce, with sales and service accounting for nearly a quarter of all employed. Occupations in anufacturing, on the other hand, accounted for only 3.6 per cent of the employed. Employment was lowest in Arts, Culture, Recreation and Sport occupations.
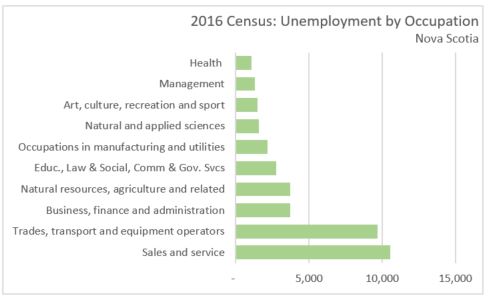
Unemployment (by raw numbers) was highest in sales and service, followed by trades and transport occupations, business and finance occupations, and natural resource and agriculture occupations. Lowest unemployment was in health occupations, followed by management.
ABORIGINAL IDENTITY AND RACIALLY VISIBLE PERSONS
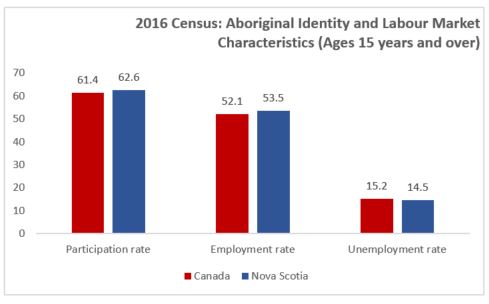
Nova Scotia had 25,030 workers of Aboriginal Identity in the labour force, with an overall participation rate of 62.6 for this group, and an unemployment rate of 53.5 per cent. Both of these figures are slightly higher than the national average.
Participation rates were highest in the 25-34 age group (78.8 per cent) and in the 35-44 year age group (82.5 per cent). Employment rates were highest in the 35-44 and 45-54 year age groups (73.6% and 68.8%, respectively).
Those who identified in Statistics Canada's "Visible Minority" category (30,400) made up 6.9 per cent of the labour force, with participation rates slightly lower (58.6%) than the Nova Scotia average (61.6%) and employment rates also slightly lower than the provincial average (53.8% compared to 55.4%).

For the highlight document, "Labour in Canada: Key Results from the 2016 Census", visit the Statistics Canada page.
<--- Return to Archive