The Economics and Statistics Division maintains archives of previous publications for accountability purposes, but makes no updates to keep these documents current with the latest data revisions from Statistics Canada. As a result, information in older documents may not be accurate. Please exercise caution when referring to older documents. For the latest information and historical data, please contact the individual listed to the right.
<--- Return to Archive
For additional information relating to this article, please contact:
November 22, 2017GOVERNMENT FINANCIAL STATISTICS, 2016 Statistics Canada has published the latest Consolidated Government Finance Statistics for 2016 including consolidated results for provincial-territorial and local governments. These data are based on the international government financial statistical standard and, as such, may differ in their presentation from similar concepts reported in Public Accounts and other financial statements. Statistics Canada's data allows for comparability across jurisdictions, as well as consistency with the government consumption and investment data reported in macroeconomic accounts.
The following analysis compares the per capita results for consolidated Provincial/Territorial-and-Local governments (PTLG). Local governments are consolidated into the analysis because each provincial government may assign different responsibilities to municipal or local governments.
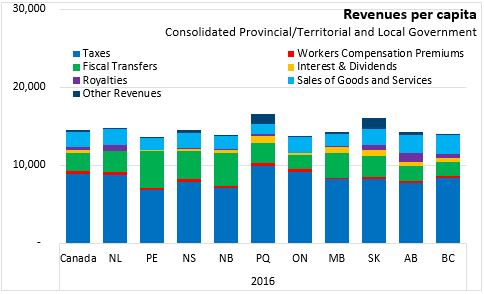
Total revenues per capita vary across the country, with Nova Scotia's PTLG revenues amounting to $14,519 per capita. This is similar to the Canadian average of $14,597 per capita. The highest per capita revenues are in Quebec, where the government offers a different mix of public services, including delivering some services that are otherwise delivered by the Federal government (the value of the Quebec abatement to Federal taxes are removed from these figures). The lowest revenues are in Prince Edward Island.
Taxes are the largest source of PTLG revenues, amounting to $8,920 per capita across Canada. Nova Scotia's tax revenues are over $1,000 per capita lower than the national average at $7,905 per capita. The highest tax revenues are in Quebec (even after adjusting for the Quebec abatement of Federal taxes).
Tax revenues break down into 8 major categories, including personal income taxes, corporate income taxes, general sales taxes, excise taxes on specific items, payroll taxes, property taxes, profits from the monopolies on liquor sales/gaming and user fees. The amount of revenues generated by these taxes reflects both the tax system itself (tax rates, deductions, credits, number of taxes levied) as well as overall economic conditions. There are also differences in specific taxes across Canada. Only Newfoundland and Labrador, Quebec, Ontario and Manitoba levy payroll taxes. Property taxes are higher in jurisdictions that allocate more duties to the municipal level of government, which relies more heavily on this tax base alone. Corporate income taxes are higher in Ontario, Alberta, Quebec and Saskatchewan. Alberta levies no general sales taxes but has higher revenues from excise taxes and liquor/gaming activities (as do Saskatchewan and Newfoundland and Labrador). User fee revenues per capita are notably higher in the three westernmost provinces as well as in Newfoundland and Labrador. Revenue from sales of goods and services includes tuition fees.
Beyond taxes and user fees, governments generate revenues from social insurance premiums (such as workers compensation), fiscal transfers, interest/dividend income, royalties and sales of goods/services. Those provinces that are Equalization recipients report higher fiscal transfer revenues per capita, particularly in Atlantic Canada and Manitoba. Provinces with substantial oil and gas sectors (and to a lesser extent hydroelectricity and forestry) report stronger royalty income. Saskatchewan and Quebec also report substantially higher revenues from other sources, though this may include specific items that cannot be classified with others.
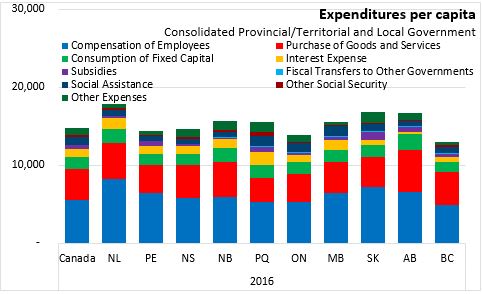
Total PTLG expenditures in Canada were $14,819 per capita. Nova Scotia's PLTG expenditures were slightly lower at $14,617 per capita. The highest expenditures were in Newfoundland and Labrador, Alberta and Saskatchewan while the lowest were in Ontario and British Columbia.
Employee compensation is the largest component of PTLG expenditures, amounting to $5,612 per capita. The highest employee compensation expenditures per capita are found in Newfoundland and Labrador, Saskatchewan and Alberta. The lowest are reported in Quebec, Ontario and British Columbia. Nova Scotia's per capita employee compensation expenditures were $5,798.
Purchases of goods and services was the next largest expenditure category with an average PTLG expenditure of $3,906 per capita. Expenditures on goods and services were highest in Alberta and Newfoundland and Labrador and lowest in Quebec.
Interest expenses depend on net financial liabilities and costs of funds. Across Canada, PTLG expenditures on interest payments averaged $981 per capita while interest costs were $1,019 per capita in Nova Scotia. The highest interest expenditures were in Quebec, Newfoundland and Labrador and Manitoba. The lowest interest expenditures were in Saskatchewan, British Columbia and Alberta.
Subsidies (particularly in agriculture) are uneven across the country, with the highest payments in Saskatchewan, Quebec, Alberta and Prince Edward Island. The remaining Atlantic Provinces had the lowest per capita subsidy expenditures.
Social assistance and family/employment benefit expenditures per capita were $1,283 per capita across Canada, including notably higher expenditures in Quebec, Ontario and Manitoba. Alberta and the Maritimes reported the lowest social benefit expenditures with Nova Scotia's amounting to $736 per capita.
All other expenditure categories (including net transfers to other governments) amounted to $970 per capita for PLTGs in Canada with higher expenditures in Saskatchewan, Quebec and New Brunswick. Nova Scotias expenditures in other categories was $1,019 per capita.
In addition to categorizing expenditures by type of spending, Statistics Canada also reports expenditures by function. There are nine functional areas of expenditure in consolidated PLTG spending: health care, education, social protection, general public service (which includes debt payments), economic affairs (which includes transportation), public order/safety, environmental protection, housing/community amenities and recreation/culture/religion.
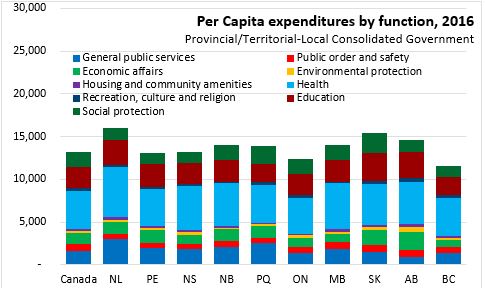
Health care expenditures were the largest functional area with an average PTLG expenditure of $4,475 per capita. Nova Scotia's health function expenditures were $5,108. The highest expenditures in health were reported in Newfoundland and Labrador, Manitoba and Nova Scotia. Ontario, Quebec and British Columbia reported lower than average health expenditures per capita.
Education expenditures by Canadian PTLGs averaged $2,455 per capitain 2016 with $2,500 per capita spent in Nova Scotia. The highest education expenditures were in Saskatchewan, Alberta and Newfoundland and Labrador. The lowest were in Quebec and British Columbia.
Expenditures on social protection averaged $1,770 per capita across Canada with the highest expenditures in Saksatchewan and Quebec. Nova Scotia's per capita expenditures on social protection were $1,300 per capita.
General public service expenditures (including debt service costs) averaged $1,658 per capita across Canadian PTLGs, including $1,807 in per capita expenditures for Nova Scotia. The highest per capita expenditures were in Newfoundland and Labrador and Quebec.
Statistics Canada also reported on net financial worth of Provincial/Territorial and Local Governments. Note that this concept differs from Net Debt reported in Public Accounts. All provinces except Alberta report negative net financial worth, with an average of -$14,758 per capita across Canada. Alberta remains unique in a positive net financial worth with $1,307 per capita. British Columbia and Saskatchewam have the smallest negative net financial worth, followed by Nova Scotia at -$12,501 per capita. The highest negative net financial worth is reported in Quebec, Ontario and Manitoba.
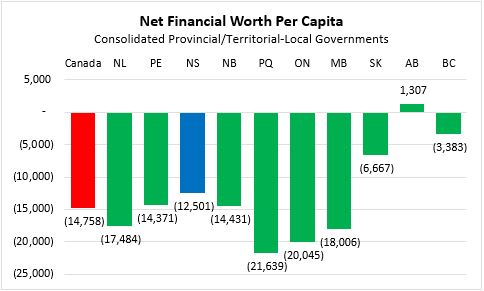
After the financial crisis of 2007-2008, all PTLGs reported an erosion in net financial worth. The largest deterioration between 2007 and 2016 was reported in Alberta, followed by Manitoba. The least erosion in net financial liabilities over this period were reported in British Columbia and Nova Scotia.

Statistics Canada: CANSIM tables 385-0041 and 385-0042
<--- Return to Archive