The Economics and Statistics Division maintains archives of previous publications for accountability purposes, but makes no updates to keep these documents current with the latest data revisions from Statistics Canada. As a result, information in older documents may not be accurate. Please exercise caution when referring to older documents. For the latest information and historical data, please contact the individual listed to the right.
<--- Return to Archive
For additional information relating to this article, please contact:
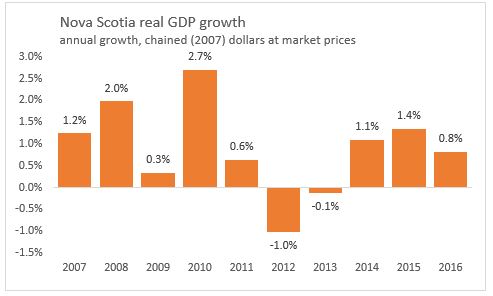
November 08, 2017PROVINCIAL ECONOMIC ACCOUNTS 2016 - NOVA SCOTIA TRENDS The Nova Scotia economy grew 0.8 per cent in 2016 following on growth of 1.4 per cent in 2015 and 1.1 per cent in 2014 and two years of decline in 2012 and 2013.
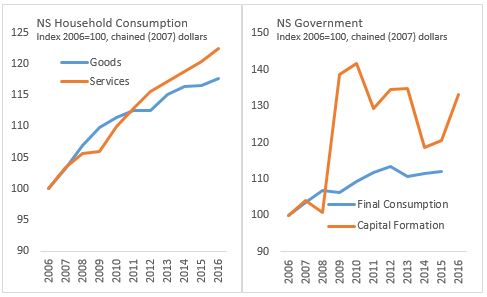
Real household consumption increased 1.3 per cent in 2016, a similar pace as the average 5-year pace of 1.4 per cent. Goods consumption increased 0.9 per cent as durable goods consumption increased. Service consumption grew at a pace of 1.8 per cent. General governments final consumption expenditure was up 1.2 per cent in 2016 and after growth of 0.6 per cent and 0.5 per cent the previous two years. Government fixed capital formation increased 10.5 per cent.
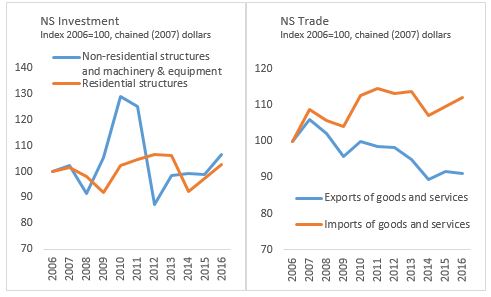
Residential investment increased 5.5 per cent after a growth of 5.4 per cent in 2014 and a 13.0 per cent decline in 2013. Non-residential structures were up 17.4 per cent with work on Maritime Transmission Link and Touquoy gold mine, and follows on growth of 16.6 per cent in 2014 and 5.0 per cent in 2013. Machinery and equipment was up 0.6 per cent while intellectual property products increased 21.0. Volumes of exports of goods and services were down 0.7 per cent in 2016 as exports of goods declined 4.5 per cent. Exports of goods to other countries has declined in three of last four years. Export of services to other countries was up (+0.4%) for a fifth consecutive year and export to other provinces (+1.7%) also increased.
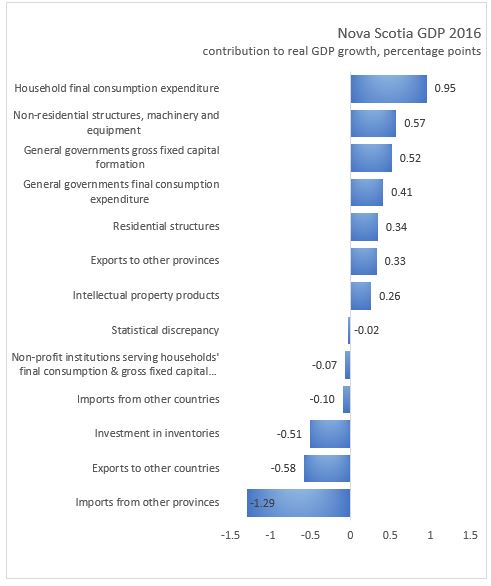
For 2016, the largest positive contributions to GDP came from increasing household consumption (0.95%) and non-residential structures/machinery and equipment (+0.57%). Positive contributions were also made from increases in government consumption and investment, residential structures, intellectual property products, exports to other provinces. Partially offsetting the gains negative contributions come from lower exports to other countries and inventories. Imports from other countries and other provinces increased and thus make a negative contribution to GDP growth.
<--- Return to Archive