The Economics and Statistics Division maintains archives of previous publications for accountability purposes, but makes no updates to keep these documents current with the latest data revisions from Statistics Canada. As a result, information in older documents may not be accurate. Please exercise caution when referring to older documents. For the latest information and historical data, please contact the individual listed to the right.
<--- Return to Archive
For additional information relating to this article, please contact:
November 08, 2017BUILDING PERMITS, SEPTEMBER 2017 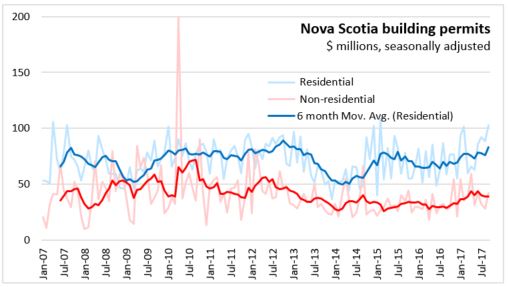
The value of building permits issued in Nova Scotia increased by 23.8 per cent in September, following a 6.3 per cent decrease in August. Residential permits were up 16.0 per cent while non-residential building permits increased 48.3 per cent. Monthly results for building permits are highly volatile; the six-month moving average of both residential and non-residential permits have trended modestly upwards in 2017.
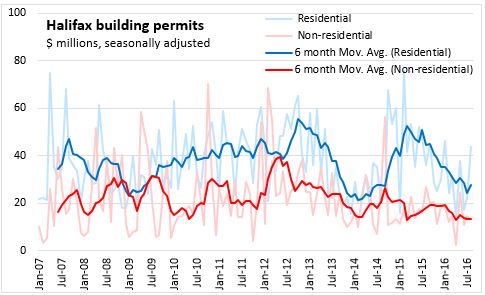
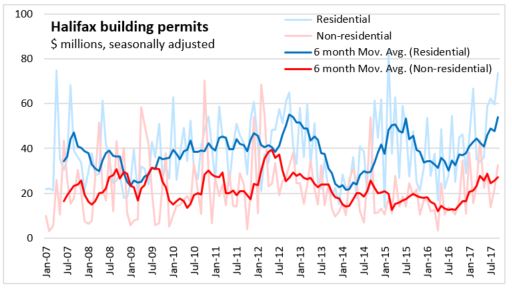
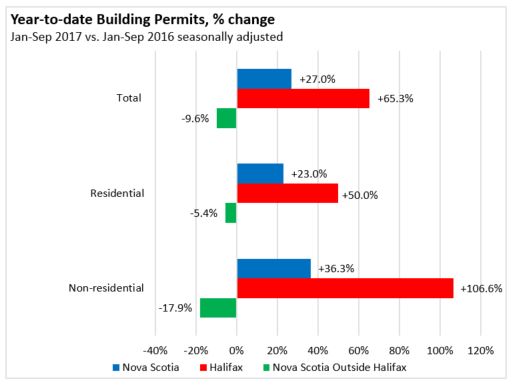
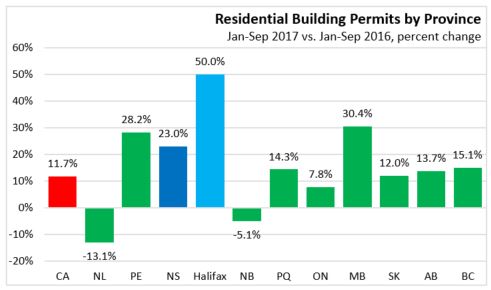
The trend in Nova Scotia building permit values particularly reflects the trends in the Halifax market. The value of Halifax building permits increased 29.4 per cent in September 2017 reflecting an increase in non-residential (46.4 per cent) and in residential (23.0 per cent) permits. Residential and non-residential permits in Halifax have been on the rise since mid-2016 following a downward trend through much of 2015 and early 2016.
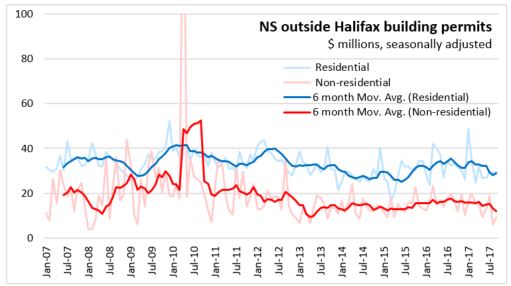
Outside the Halifax market, building permit values decreased 10.9 per cent in September with an increase in non-residential permits of 55.2 per cent and a modest increase in residential permits of 1.6 per cent.
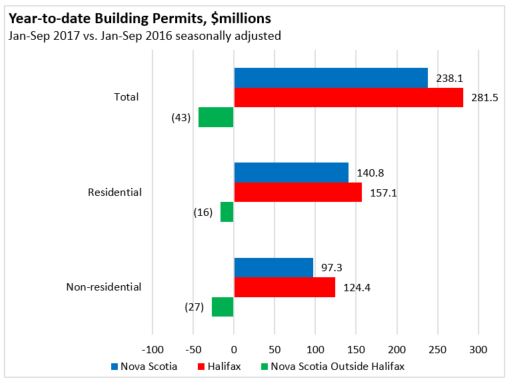
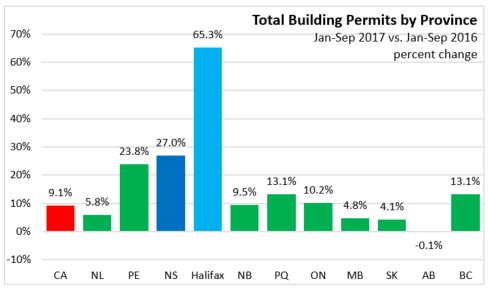
Comparing the first nine months of 2017 with the same period in 2016, NS building permits were up 27.0 per cent reflecting an increase in both residential (23.0 per cent) and non-residential (36.3 per cent) building permits. Non-residential permit gains have occurred with increases in industrial (+20.0%), commercial (+44.5%), and institutional and governmental (+23.2%). Commercial building permits account for the majority of the dollar increase in non-residential permits with increasing permits for trade/service buildings, office buildings and the hotels/restaurants category.
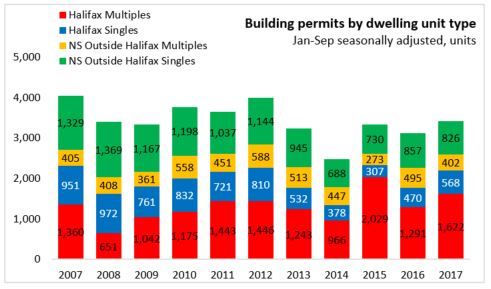
Year-to date permitted dwelling units in Nova Scotia were up 305 units, reflecting an increase in multiples and singles in Halifax. However, permitted dwelling units outside Halifax were down 124 units reflecting a decrease in both singles and multiples.
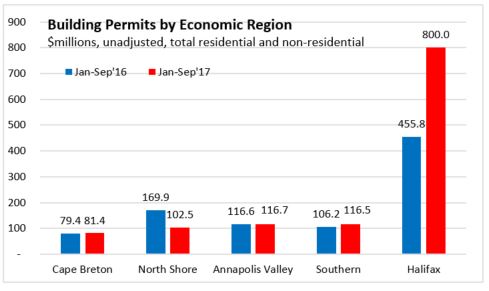
Compared with January through September 2016, year to date 2017 building permit values (unadjusted) were up in four of the five economic regions, with the largest gains in Halifax, followed by Cape Breton and Southern Nova Scotia. Permit values were lower in North Shore, while values were up only slightly in the Annapolis Valley region.
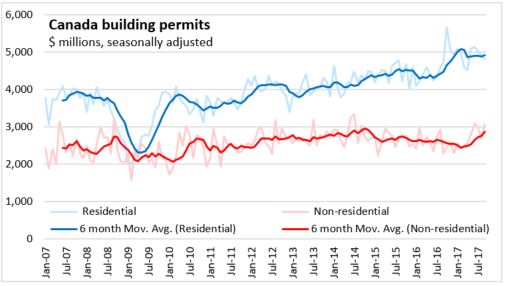
Nationally, residential building permit values were on an upward trend in 2016 but have levelled off in 2017. Non-residential building permit values have picked up in 2017 after declining through 2015 and 2016. Compared to January through September of 2016, both residential permits (11.7 per cent) and non-residential permit (4.9 per cent) were up nationally in the first nine months of 2017.
Comparing the first nine months of 2017 to the same period in 2016, among other provinces Manitoba reported the largest gains in residential building permit values followed by Prince Edward Island and Nova Scotia in percentage terms. Newfoundland and Labrador, and New Brunswick reported declines.
Comparing the first nine months of 2017 to the same period in 2016, non-residential building permits increased in seven provinces led in percentage terms by Newfoundland and Labrador and Nova Scotia. Manitoba, Saskatchewan, and Alberta reported declines.

Comparing the first nine months of 2017 to the same period in 2016, overall building permit values were down in Alberta, while all other provinces observed gains.
Sources: CANSIM 026-0006 and 026-0005
Statistics Canada Cat. No. 64-001-X
<--- Return to Archive