The Economics and Statistics Division maintains archives of previous publications for accountability purposes, but makes no updates to keep these documents current with the latest data revisions from Statistics Canada. As a result, information in older documents may not be accurate. Please exercise caution when referring to older documents. For the latest information and historical data, please contact the individual listed to the right.
<--- Return to Archive
For additional information relating to this article, please contact:
October 23, 2017WHOLESALE TRADE, AUGUST 2017 
In Nova Scotia August 2017, the seasonally adjusted index of growth (2011=100) declined to 124.3. Since January 2017, growth in wholesale trade has been highly volatile: starting at 131.7 in January, declining to a low of 122.9 in February, increasing sharply to a new high of 141.8 in May, only to decline sharply to 125.5 in July.
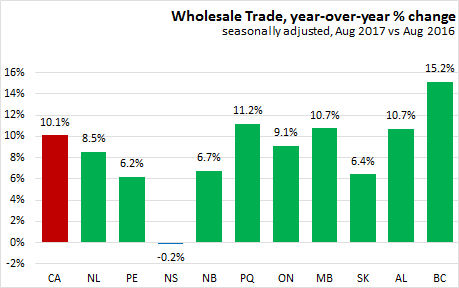
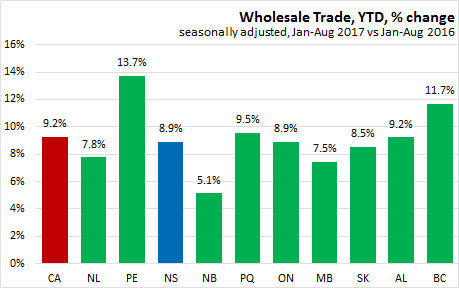
In Nova Scotia August 2017, on a seasonally adjusted basis month-over-month wholesale sales decreased 1.0 per cent to $811 million. On a year-over-year basis, wholesale sales were 0.2 per cent lower over August 2016. On a year-to-date basis (Jan-Aug total) wholesale sales were 8.9% higher than the same period last year.
In Canada August 2017, on a seasonally adjusted basis the wholesale index of growth (2011=100) increased 0.7 points to 133.9. On a month-over-month basis, wholesale sales increased 0.5 per cent to $62.8 billion. On a year-over-year basis, wholesale sales were 10.1 per cent higher over August 2016. On a year-to-date basis (jan-Aug totals) wholesale sales were 9.2% higher than the same period last year.
In Canada August 2017, sales were up in four of seven industries:
- Personal and household goods sales were up 3.3% to $9.0 billion.
- Motor vehicle and parts increased 2.0% to $11.8 billion
- Miscellaneous subsector increased 1.6% to $8.1 billion.
- Building materials and supplies were down 3.5% to $8.7 billion.
By Province

In month-over-month seasonally adjusted wholesale sales, Nova Scotia (-1.0%) ranked 8th. Prince Edward Island led the way with sales increasing 5.4%. Five of ten provinces reported positive growth. Sales were down in five provinces.
On a year-over-year basis, Nova Scotia (-0.2%) was the only province reporting negative growth. British Columbia led the way with growth in sales increasing 15.2% over August 2016. Alberta (+10.7%), Manitoba (+10.2%) and Quebec (+11.2%) also recorded double digit growth over the same period last year. The other three provinces reported single digit, positive growth in the 6.2% to 8.5% range.
On a year-to-date basis, Nova Scotia (+8.9%) ranked 5th. Prince Edward Island recorded the highest sales growth at 13.7% and British Columbia (+11.7%) beat out Quebec (+9.5%) for third spot. All ten provinces recorded positive growth with two provinces recording double digit growth. The other provinces reported single digit growth in the range of 5.1% to 9.5%. Canada recorded a solid 9.2% growth in wholesale trade.
Nova Scotia Sectors
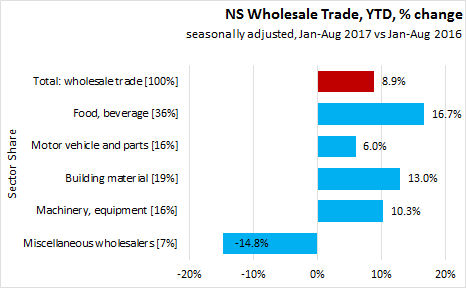
Statistics Canada now releases seasonally adjusted wholesale trade data by sector at the provincial level. As there has been significant volatility in recent wholesale values for Nova Scotia. Year-to-date comparisons are more indicative of economic conditions for volatile indicators and seasonally adjusted wholesale values will also smooth out the indicator.
Year-to-date wholesale sales by sector in Nova Scotia increased by $551 million, or by 8.9 per cent compared to Jan-Aug 2016. The dollar increase was largely accounted for by four subsectors: Food, beverage and tobacco wholesalers (+$351 million); building material and supplies wholesalers (+$150 million), Machinery/equipment ($101 million), and Motor vehicle and parts ($62 million). One subsector had a decline: miscellaneous wholesalers declined $79 million.

Statistics Canada: CANSIM table 081-0011
<--- Return to Archive