The Economics and Statistics Division maintains archives of previous publications for accountability purposes, but makes no updates to keep these documents current with the latest data revisions from Statistics Canada. As a result, information in older documents may not be accurate. Please exercise caution when referring to older documents. For the latest information and historical data, please contact the individual listed to the right.
<--- Return to Archive
For additional information relating to this article, please contact:
September 13, 20172016 CENSUS: INCOME Today, Statistics Canada released data from the 2016 Census on the income of Canadians with the data covering income as measured in 2015. Trends in income are compared to 2005 in constant dollars.
The median total income for a household in Canada was $70,336 in 2015, ranging from a high of $93,835 in Alberta to a low of $59,347 in New Brunswick. Nova Scotia's median household income was below the national average at $60,764. Within Nova Scotia, median total income ranged from $47,548 in Queens county to $69,522 in Halifax county.
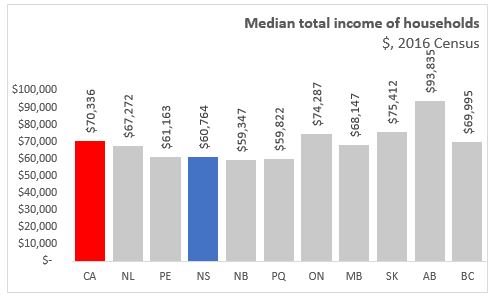

Income growth, after adjusting for inflation, for Canada was 10.8 per cent over the decade 2005 to 2015. Resource based provinces and regions had the highest income growth while median income growth was slower in areas with significant manufacturing activity. Nova Scotia income growth at 10.2 per cent was slightly below the national average.

The 2016 Census uses two indicators to measure the prevalence of low-income both before and after taxes in the population. The Low-income measure (LIM) refers to the share of persons in households with incomes that are at least 50% lower than the Canadian median household income with adjustments made to account for household size. A rising Canadian median income will increase the proportion below the LIM mesaure if incomes below the median are not increasing at the same pace. The Low-income cut-offs (LICO-AT) defines a threshold below which economic families or persons not in economic families would likely devote a larger than average share of income to necessities (food, shelter, and clothing). Spending of necessities needs to be 20 percentage points more than the average family after accounting for family size and community population size. The low-income concepts are not applied in the territories or Indian reserves.
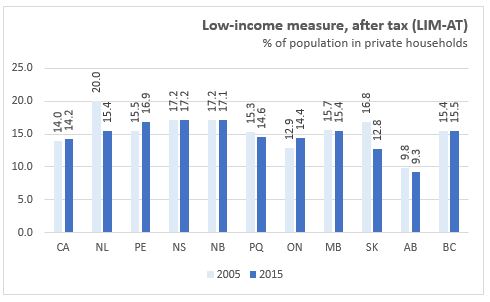
In 2015, prevalence of the low income as measured by the Low-income measure after tax (LIM-AT) was 14.2 per cent in Canada. All the Atlantic provinces had higher rate of low-income by this measure than the national average. The low-income cutoff after tax measure (LIM-AT) for Canada was 9.2 per cent with all Atlantic provinces reporting a lower rate than the national average.

Within Nova Scotia the LIM-AT measure varied from a low of 14.8 per cent in Halifax to 25.3 per cent in Annapolis. The LICO-AT measured ranged from 3.5 per cent in Victoria to 9.6 per cent in Halifax.

From 2005 to 2015 the LIM-AT increases in Canada from 14.0 per cent to 14.2 per cent. Nova Scotia LIM-AT was unchanged between 2005 and 2015.
From 2005 to 2015 the LICO-AT decreased in Canada from 11.4 per cent to 9.2 per cent. Nova Scotia LIM-AT decreased from 9.6 per cent to 7.9 per cent between 2005 and 2015.

Source: Statistics Canada 2016 Census Daily Article | Tables
<--- Return to Archive