The Economics and Statistics Division maintains archives of previous publications for accountability purposes, but makes no updates to keep these documents current with the latest data revisions from Statistics Canada. As a result, information in older documents may not be accurate. Please exercise caution when referring to older documents. For the latest information and historical data, please contact the individual listed to the right.
<--- Return to Archive
For additional information relating to this article, please contact:
August 25, 2017NOVA SCOTIA GOODS EXPORTS TO THE US-SOUTHEAST REGION 2016 MARKETS – SOUTHEAST US EXPORT MARKET COMPARED WITH NS GLOBAL EXPORT TRADE
In 2016 Nova Scotia produced and exported $5.2 billion worth of goods to the international market. The United States was the destination of the largest proportion of Nova Scotia’s global exports (68.97% share, $3.6 billion). China was the number two destination at a 9.39% share ($491 million), Europe was the third largest geographic market at an 8.57% share ($448 million). And Asia (excluding the Middle East and China) was the number fourth destination (8.81% share, $460.5 million). The balance of Nova Scotia's export trade (4.26%) was distributed among Central/South America, the Caribbean, Africa, the Middle East and Oceania countries.

In 2016 Nova Scotia produced and exported $1.101 billion worth of goods to the Southeast region of the United States. This market represents 30.54% of Nova Scotia’s US export trade and 21.06% of Nova Scotia’s global export trade.
US-SOUTHEAST BY STATE

There are twelve states in the US Southeast region. Over 62% of Nova Scotia exports to this region go to one US state – South Carolina. In 2016, this state is the recipient of 62% of Nova Scotia exports to this region. It includes 88.6% of Nova Scotia Rubber Products (mostly Tires) exports to the Southeast region and 48.1% of total NS Exports of Rubber products to the US.
LONG RUN TRENDS
Trade with the Southeast-US has exhibited steady, increasing growth over the last fifteen years. Overall, the trend appears as a slow year-over-year decline early in the period up to the global trade collapse (2008-2009), followed by a multi year-over-year strong recovery to a period high in 2016.
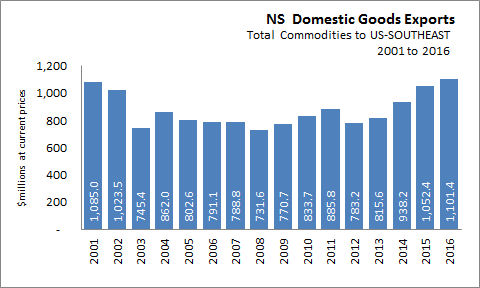
Trade has recovered from the global downturn when trade bottomed out at $731 million – a 48.3% decline in 2008 over 2001. New levels, greater than the previous high in 2001, were realized in 2016.
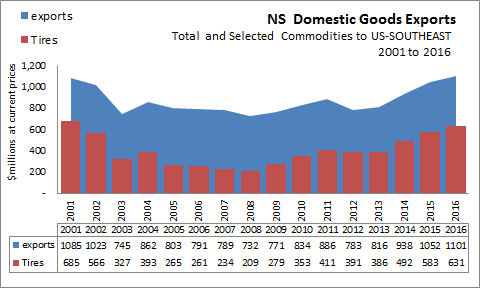
Most of the growth in exports has been in one product group – Tires. Share of total exports has ranged from a low of 29% in 2008 to a high of 57% in 2016.
.
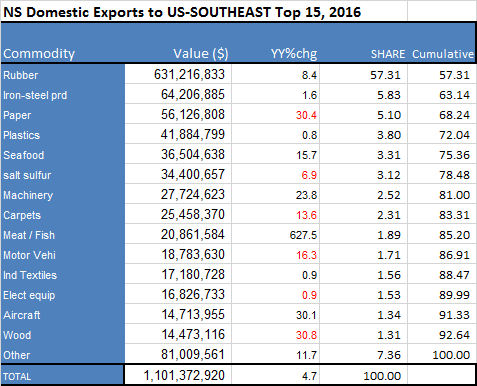
PRODUCTS – LEADING NOVA SCOTIA EXPORTS TO SOUTHEAST US
Nova Scotia companies produced and shipped $1.101 billion worth of goods to US-Southeast in 2016 as compared to the $1.052 million last year and $783.2 million in 2012. Since 2012, the value of exports has increased 40.6%, and have increased 4.7% over 2015.
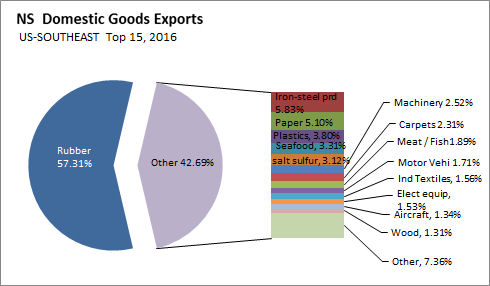
Rubber products, mostly tires, exports have been the consistent number one product since 2001. Export value has ranged from a low of $209 million in 2008, to a high of $685 million in 2001. In 2016, exports of Rubber products increased 8.4% over 2015 to $631 million, the second highest export value of this commodity since 2001.
Articles of Iron and Steel have ranked second in three of the last fifteen years, and third in six years. Export values have ranged from a low of $28.7 million in 2001 to a high of $85.7 million on 2002. In 2016, exports of Iron and Steel articles increased 1.6% over 2015 to $64.2 million.
Paper, Paperboard and Articles has been another consistent export, ranking second in eleven of the last fifteen years, and third in one year. Values have ranged from a low of $2.7 million in 2002 to a high of $124 million in 2005. In 2016, exports of Paper, Paperboard declined 30.4% over 2015 to $56.1 million.
Plastics and Articles thereof have ranked third in one year, and either fourth of fifth in fourteen years. Export value has ranged from a low of $25.9 million to a high of $58.7 in 2005. In 2016, the value of exports increased 0.8% to $41.9 million.
Fish, Crustaceans, Molluscs and Other Aquatic Invertebrates (Seafood) also made the grade. Over the period 2001-2016, this product group ranked between fourth and ninth in any given year. Export value ranged from a low of $21.6 in 2008 to a high of $37.5 in 2001. In 2016, the value of exports posted increased 15.7% over 2015 to $36.5 million.
Salt, Sulphur and Earths products have ranked second in two of the last fifteen years and third in another six years. The export product has not fallen below the seventh rank in the last fifteen years. Export value has ranged from a low of $22.2 million in 2012, to a high of $74.2 million in 2006. In 2016, the value of exports posted was $34.4 million.
Distribution of the top five export goods to Southeast-US, Selected Years.


Industry Canada's Strategis and STC Trade Database
<--- Return to Archive